<< Chapter < Page Chapter >> Page >
This module is from Elementary Algebra by Denny Burzynski and Wade Ellis, Jr. In this chapter the student is shown how graphs provide information that is not always evident from the equation alone. The chapter begins by establishing the relationship between the variables in an equation, the number of coordinate axes necessary to construct its graph, and the spatial dimension of both the coordinate system and the graph. Interpretation of graphs is also emphasized throughout the chapter, beginning with the plotting of points. The slope formula is fully developed, progressing from verbal phrases to mathematical expressions. The expressions are then formed into an equation by explicitly stating that a ratio is a comparison of two quantities of the same type (e.g., distance, weight, or money). This approach benefits students who take future courses that use graphs to display information.The student is shown how to graph lines using the intercept method, the table method, and the slope-intercept method, as well as how to distinguish, by inspection, oblique and horizontal/vertical lines. This module contains an overview of the chapter "Graphing Linear Equations and Inequalities in One and Two Variables".

Overview

  • Using the Slope and Intercept to Graph a Line

Using the slope and intercept to graph a line

When a linear equation is given in the general form , a x + b y = c , we observed that an efficient graphical approach was the intercept method. We let x = 0 and computed the corresponding value of y , then let y = 0 and computed the corresponding value of x .

When an equation is written in the slope-intercept form , y = m x + b , there are also efficient ways of constructing the graph. One way, but less efficient, is to choose two or three x -values and compute to find the corresponding y -values . However, computations are tedious, time consuming, and can lead to errors. Another way, the method listed below, makes use of the slope and the y -intercept for graphing the line. It is quick, simple, and involves no computations.

    Graphing method

  1. Plot the y -intercept ( 0 , b ) .
  2. Determine another point by using the slope m .
  3. Draw a line through the two points.

Recall that we defined the slope m as the ratio y 2 y 1 x 2 x 1 . The numerator y 2 y 1 represents the number of units that y changes and the denominator x 2 x 1 represents the number of units that x changes. Suppose m = p q . Then p is the number of units that y changes and q is the number of units that x changes. Since these changes occur simultaneously, start with your pencil at the y -intercept , move p units in the appropriate vertical direction, and then move q units in the appropriate horizontal direction. Mark a point at this location.

Sample set a

Graph the following lines.

y = 3 4 x + 2

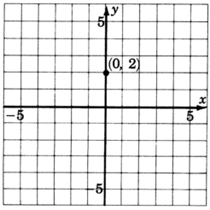
  1. The y -intercept is the point ( 0 , 2 ) . Thus the line crosses the y -axis 2 units above the origin. Mark a point at ( 0 , 2 ) .

     An xy coordinate plane with gridlines from negative five to five in increments of one unit for both axes. The point zero, two is plotted and labeled on the grid.
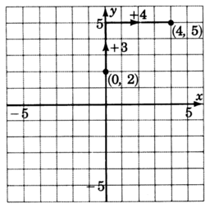
  2. The slope, m , is 3 4 . This means that if we start at any point on the line and move our pencil 3 units up and then 4 units to the right, we’ll be back on the line. Start at a known point, the y -intercept ( 0 , 2 ) . Move up 3 units, then move 4 units to the right. Mark a point at this location. (Note also that 3 4 = 3 4 . This means that if we start at any point on the line and move our pencil 3 units down and 4 units to the left , we’ll be back on the line. Note also that 3 4 = 3 4 1 . This means that if we start at any point on the line and move to the right 1 unit, we’ll have to move up 3 / 4 unit to get back on the line.)

    Starting at point with coordinates zero, two move three units up and four units right to reach to the point with coordinates four, five.
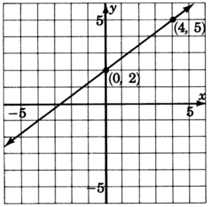
  3. Draw a line through both points.

    A graph of a line passing through two points with coordinates zero, two, and four, five.
Got questions? Get instant answers now!

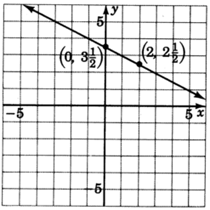
y = 1 2 x + 7 2

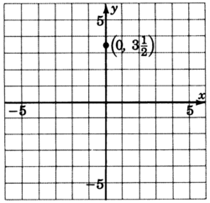
  1. The y -intercept is the point ( 0 , 7 2 ) . Thus the line crosses the y -axis 7 2 units above the origin. Mark a point at ( 0 , 7 2 ) , or ( 0 , 3 1 2 ) .

    An xy coordinate plane with gridlines from negative five to five and increments of one unit for both axes. The point zero, three and one half is plotted and labeled.
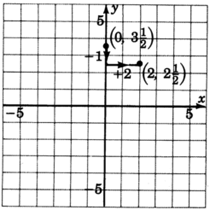
  2. The slope, m , is 1 2 . We can write 1 2 as 1 2 . Thus, we start at a known point, the y -intercept ( 0 , 3 1 2 ) , move down one unit (because of the 1 ), then move right 2 units. Mark a point at this location.

    Starting at point with coordinates zero, three and half move one unit downward and two units right to reach to the point with coordinates two, two and half.
  3. Draw a line through both points.

    A graph of a line passing through two points with coordinates zero, three and one half; and two, two and one half.
Got questions? Get instant answers now!

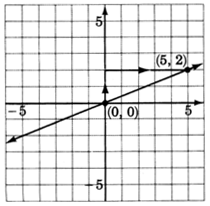
y = 2 5 x

  1. We can put this equation into explicit slope-intercept by writing it as y = 2 5 x + 0 .

    The y -intercept is the point ( 0 , 0 ) , the origin. This line goes right through the origin.
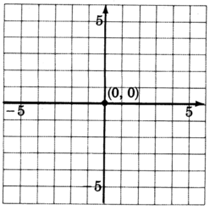
    An xy coordinate plane with gridlines from negative five to five and increments of one unit for both axes. The origin is labeled with the coordinate pair zero, zero.
  2. The slope, m , is 2 5 . Starting at the origin, we move up 2 units, then move to the right 5 units. Mark a point at this location.

    A graph of a line passing through two points with coordinates zero, zero; and five, two. Starting at a point with coordinates zero, zero moves two units up and five units to the right to reach to the point with coordinates five, two.
  3. Draw a line through the two points.
Got questions? Get instant answers now!

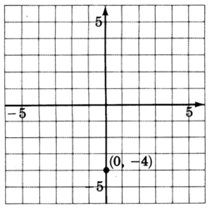
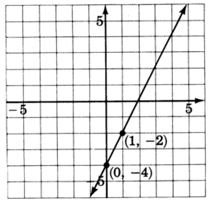
y = 2 x 4

  1. The y -intercept is the point ( 0 , 4 ) . Thus the line crosses the y -axis 4 units below the origin. Mark a point at ( 0 , 4 ) .

    A point with the coordinates zero, negative four plotted in an xy plane.
  2. The slope, m , is 2. If we write the slope as a fraction, 2 = 2 1 , we can read how to make the changes. Start at the known point ( 0 , 4 ) , move up 2 units, then move right 1 unit. Mark a point at this location.

    A graph of a line passing through two points with coordinates zero, negative four and one, negative two.
  3. Draw a line through the two points.
Got questions? Get instant answers now!

Practice set a

Use the y -intercept and the slope to graph each line.

Excercises

For the following problems, graph the equations.

Excersise for review
( [link] ) Solve the inequality 2 4 x x 3 .

x 1

Got questions? Get instant answers now!

( [link] ) Graph the inequality y + 3 > 1 .

A horizontal line with arrows on both ends.

Got questions? Get instant answers now!

( [link] ) Graph the equation y = 2 .

An xy-plane with gridlines, labeled negative five and five on the both axes.

A graph of a line parallel to x-axis in an xy plane.The line crosses the y-axis at y equals negative two.

Got questions? Get instant answers now!

( [link] ) Determine the slope and y -intercept of the line 4 y 3 x = 16 .

Got questions? Get instant answers now!

( [link] ) Find the slope of the line passing through the points ( 1 , 5 ) and ( 2 , 3 ) .

m = 2 3

Got questions? Get instant answers now!

Questions & Answers

why we learn economics ? Explain briefly
ayalew Reply
why we learn economics ?
ayalew
why we learn economics
ayalew
profit maximize for monopolistically?
Usman Reply
what kind of demand curve under monopoly?
Mik Reply
what is the difference between inflation and scarcity ?
Abdu Reply
What stops oligopolists from acting together as a monopolist and earning the highest possible level of profits?
Mik
why economics is difficult for 2nd school students.
Siraj Reply
what does mean opportunity cost?
Aster Reply
what is poetive effect of population growth
Solomon Reply
what is inflation
Nasir Reply
what is demand
Eleni
what is economics
IMLAN Reply
economics theory describes individual behavior as the result of a process of optimization under constraints the objective to be reached being determined by
Kalkidan
Economics is a branch of social science that deal with How to wise use of resource ,s
Kassie
need
WARKISA
Economic Needs: In economics, needs are goods or services that are necessary for maintaining a certain standard of living. This includes things like healthcare, education, and transportation.
Kalkidan
What is demand and supply
EMPEROR Reply
deman means?
Alex
what is supply?
Alex
ex play supply?
Alex
Money market is a branch or segment of financial market where short-term debt instruments are traded upon. The instruments in this market includes Treasury bills, Bonds, Commercial Papers, Call money among other.
murana Reply
good
Kayode
what is money market
umar Reply
Examine the distinction between theory of comparative cost Advantage and theory of factor proportion
Fatima Reply
What is inflation
Bright Reply
a general and ongoing rise in the level of prices in an economy
AI-Robot
What are the factors that affect demand for a commodity
Florence Reply
price
Kenu
Got questions? Join the online conversation and get instant answers!
Jobilize.com Reply

Get Jobilize Job Search Mobile App in your pocket Now!

Get it on Google Play Download on the App Store Now


Source:  OpenStax, Elementary algebra. OpenStax CNX. May 08, 2009 Download for free at http://cnx.org/content/col10614/1.3
Google Play and the Google Play logo are trademarks of Google Inc.

Notification Switch

Would you like to follow the 'Elementary algebra' conversation and receive update notifications?

Ask