| << Chapter < Page | Chapter >> Page > |
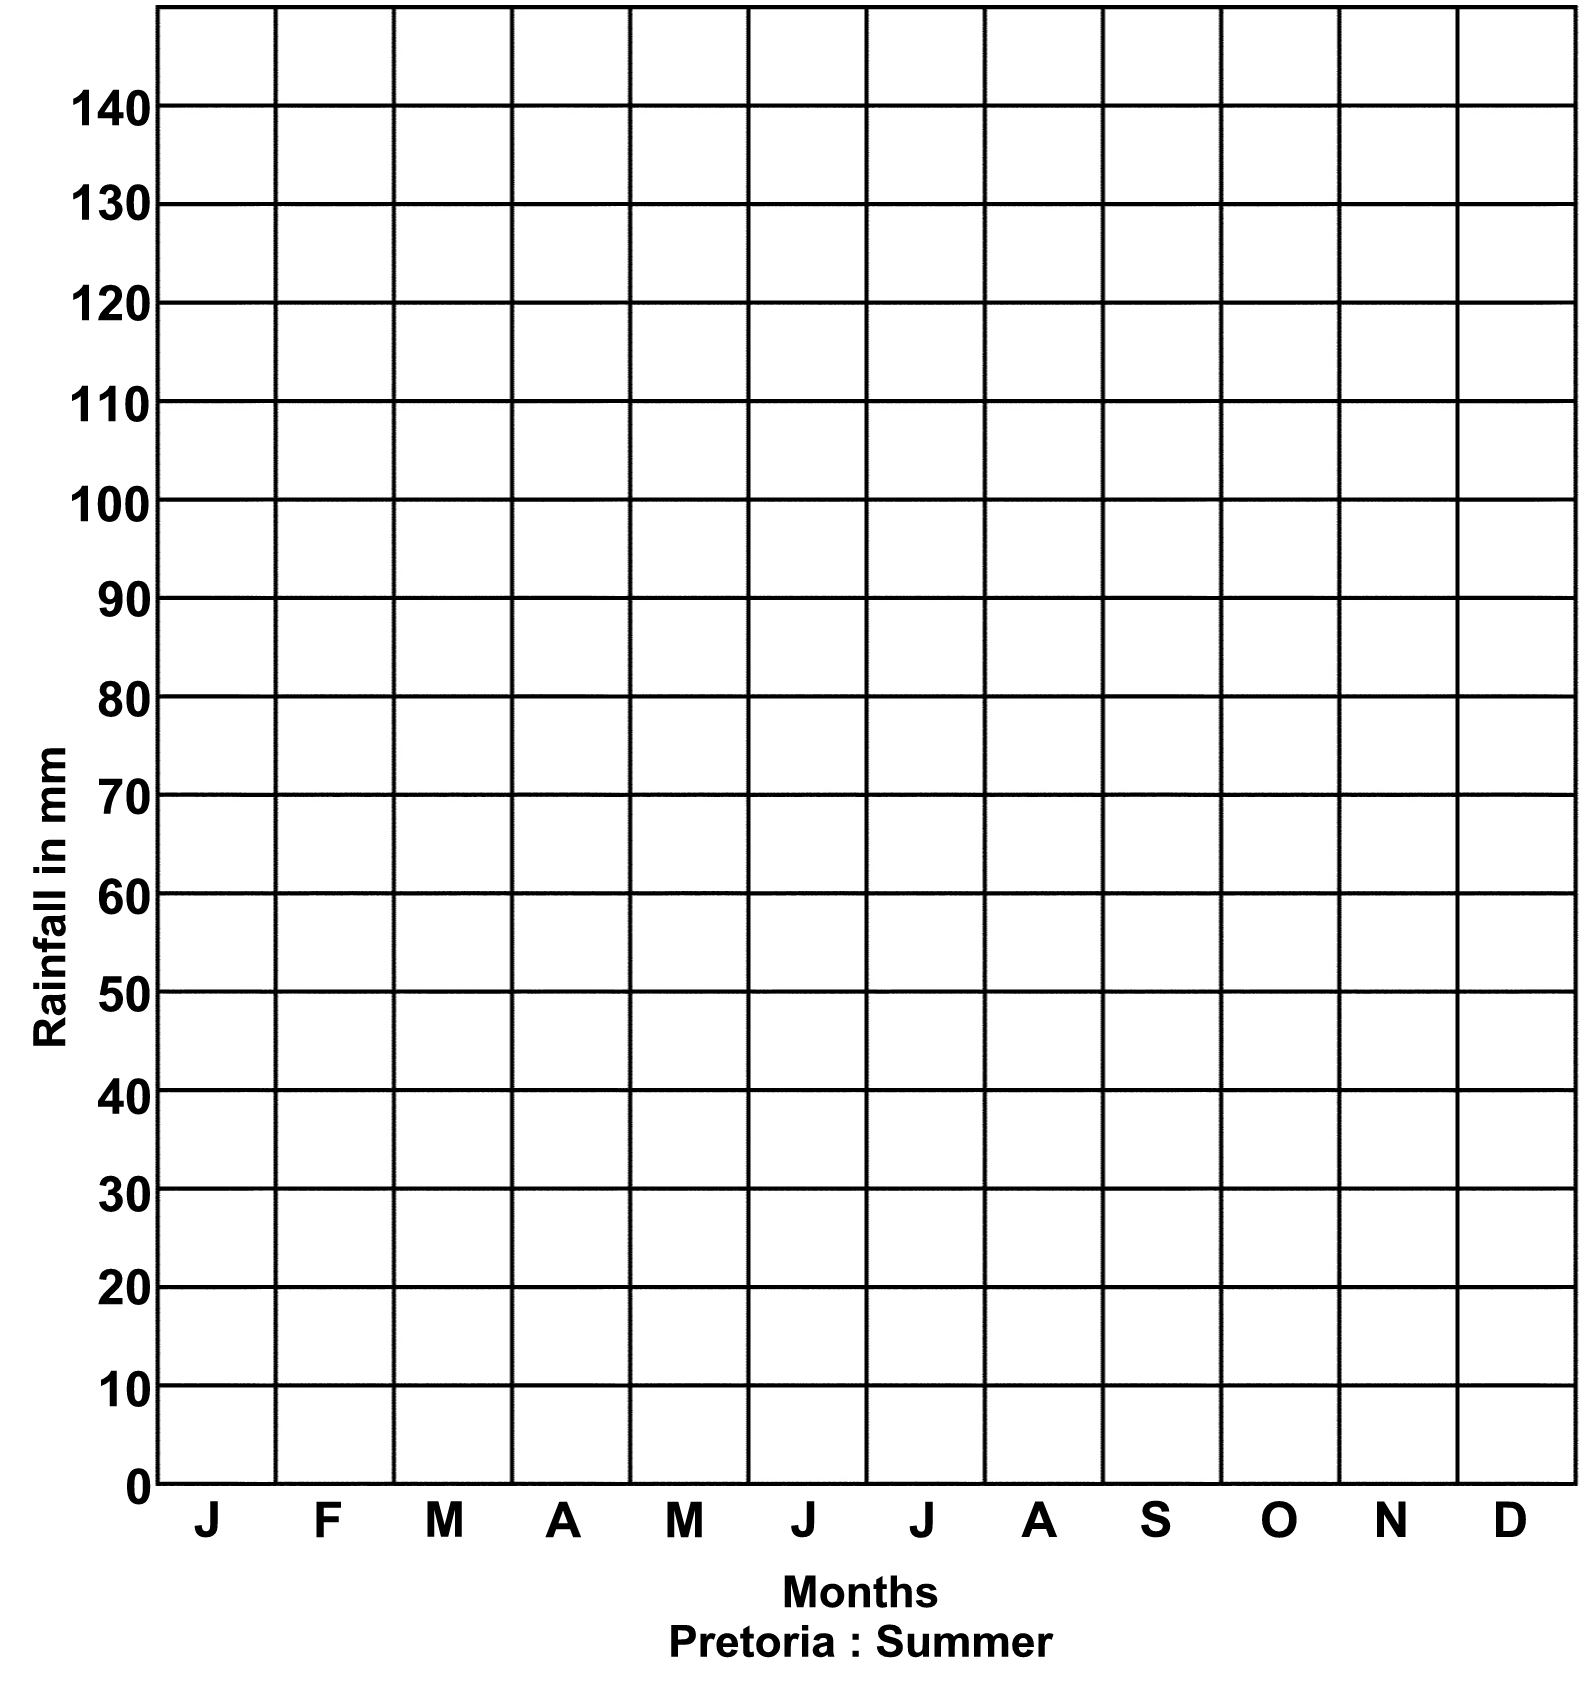
Graphic representation of rainfall for Pretoria
The area from the Breede River to Port Elizabeth gets the same amount of rain throughout the year. This varies between 500 and 1 000 mm per year. The region runs further up the coast up to the KwaZulu-Natal region, but here most of the rain falls in summer, although it rains in winter too.
The moisture-laden winds from the warm Mozambique and Agulhas currents are blocked by the escarpment and forced upwards. Condensation occurs and clouds on the seaward side of the escarpment cause the so-called relief rain.
Very thick natural forests occur in the southeast (Knysna). Indeciduous broad-leaved trees like yellowwood, stinkwood and blackwood trees are found here. Creepers like wild vines and many ferns and moss grow here in the dense shade of the gigantic trees. In the northeast the forests change to subtropical, with palm trees and mixed grasslands.
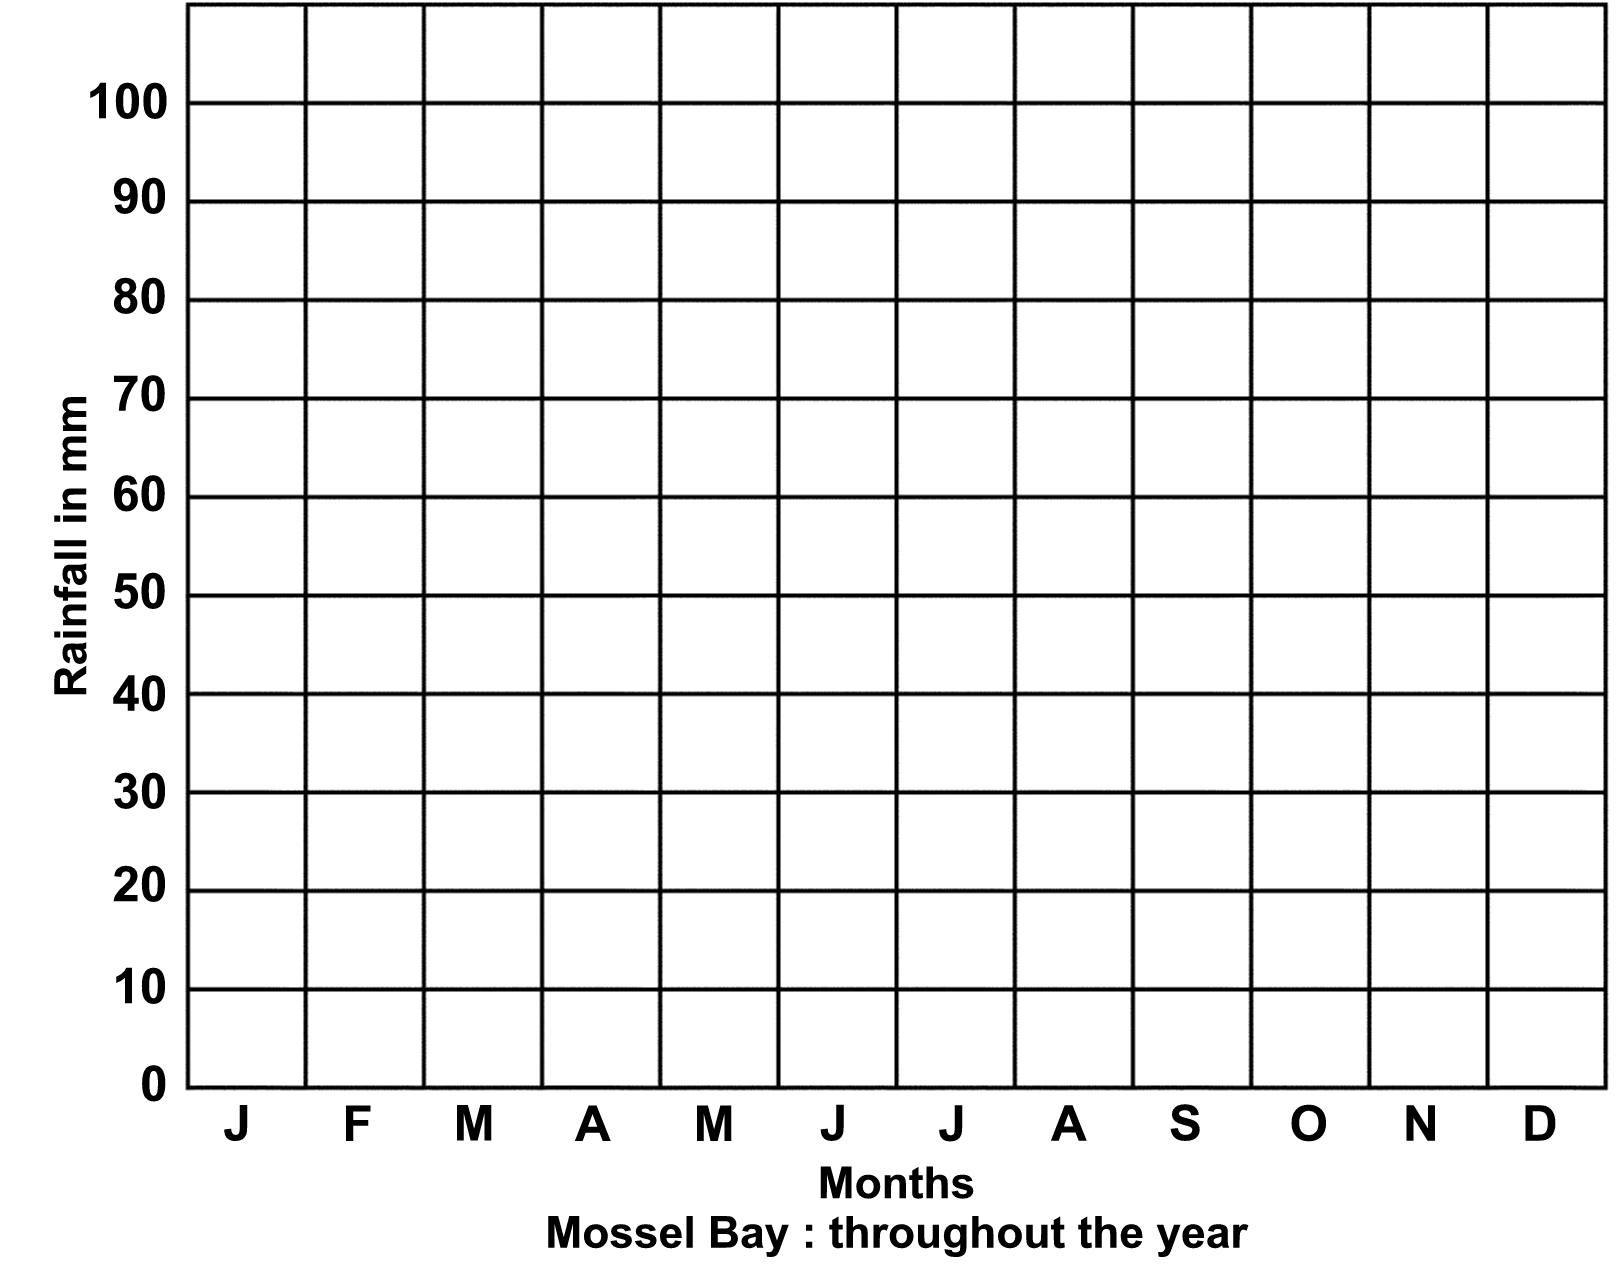
Record the rainfall information of Mossel Bay graphically in a bar graph below.
| Months | Jan | Feb | Mar | Apr | May | Jun | Jul | Aug | Sept | Oct | Nov | Dec |
| Rainfall in mm | 72 | 85 | 90 | 65 | 60 | 50 | 55 | 68 | 80 | 90 | 95 | 80 |
Graphic representation of rainfall for Mossel Bay
The major part of our country is dry. Convection rain in the form of isolated thunderstorms does bring rain. Because it is so dry, there is little vegetation, and erosion in these areas is therefore a big problem.
In the half-dry regions like the Karoo the vegetation consists of low, grey karoo shrubs like guarri and rhenoster bush and hardy grasses. In the drier areas along the west coast sparsely distributed succulents occur. These succulents have thick, fleshy leaves to store water. Some of them can survive for years without water.
Answer the questions that follow:
| Area where it rains | Type of rainfall | Amount of rain | Type of vegetation | |
|
||||
|
||||
|
||||
|
Use the rainfall map on page 1 and your atlas to say which of the following towns/cities receive the most rain:
Durban or Bloemfontein
Port Nolloth or Port Elizabeth
Cape Town or De Aar
Mossel Bay or Pretoria
Read the following statement:
Durban 1 065 mm per year
Ficksburg: 680 mm per year
Kimberley: 402 mm per year
Pofadder: 142 mm per year
Port Nolloth: 50 mm per year
What can you deduce from this data?
The graphs below show the annual rainfall for two places in South Africa.
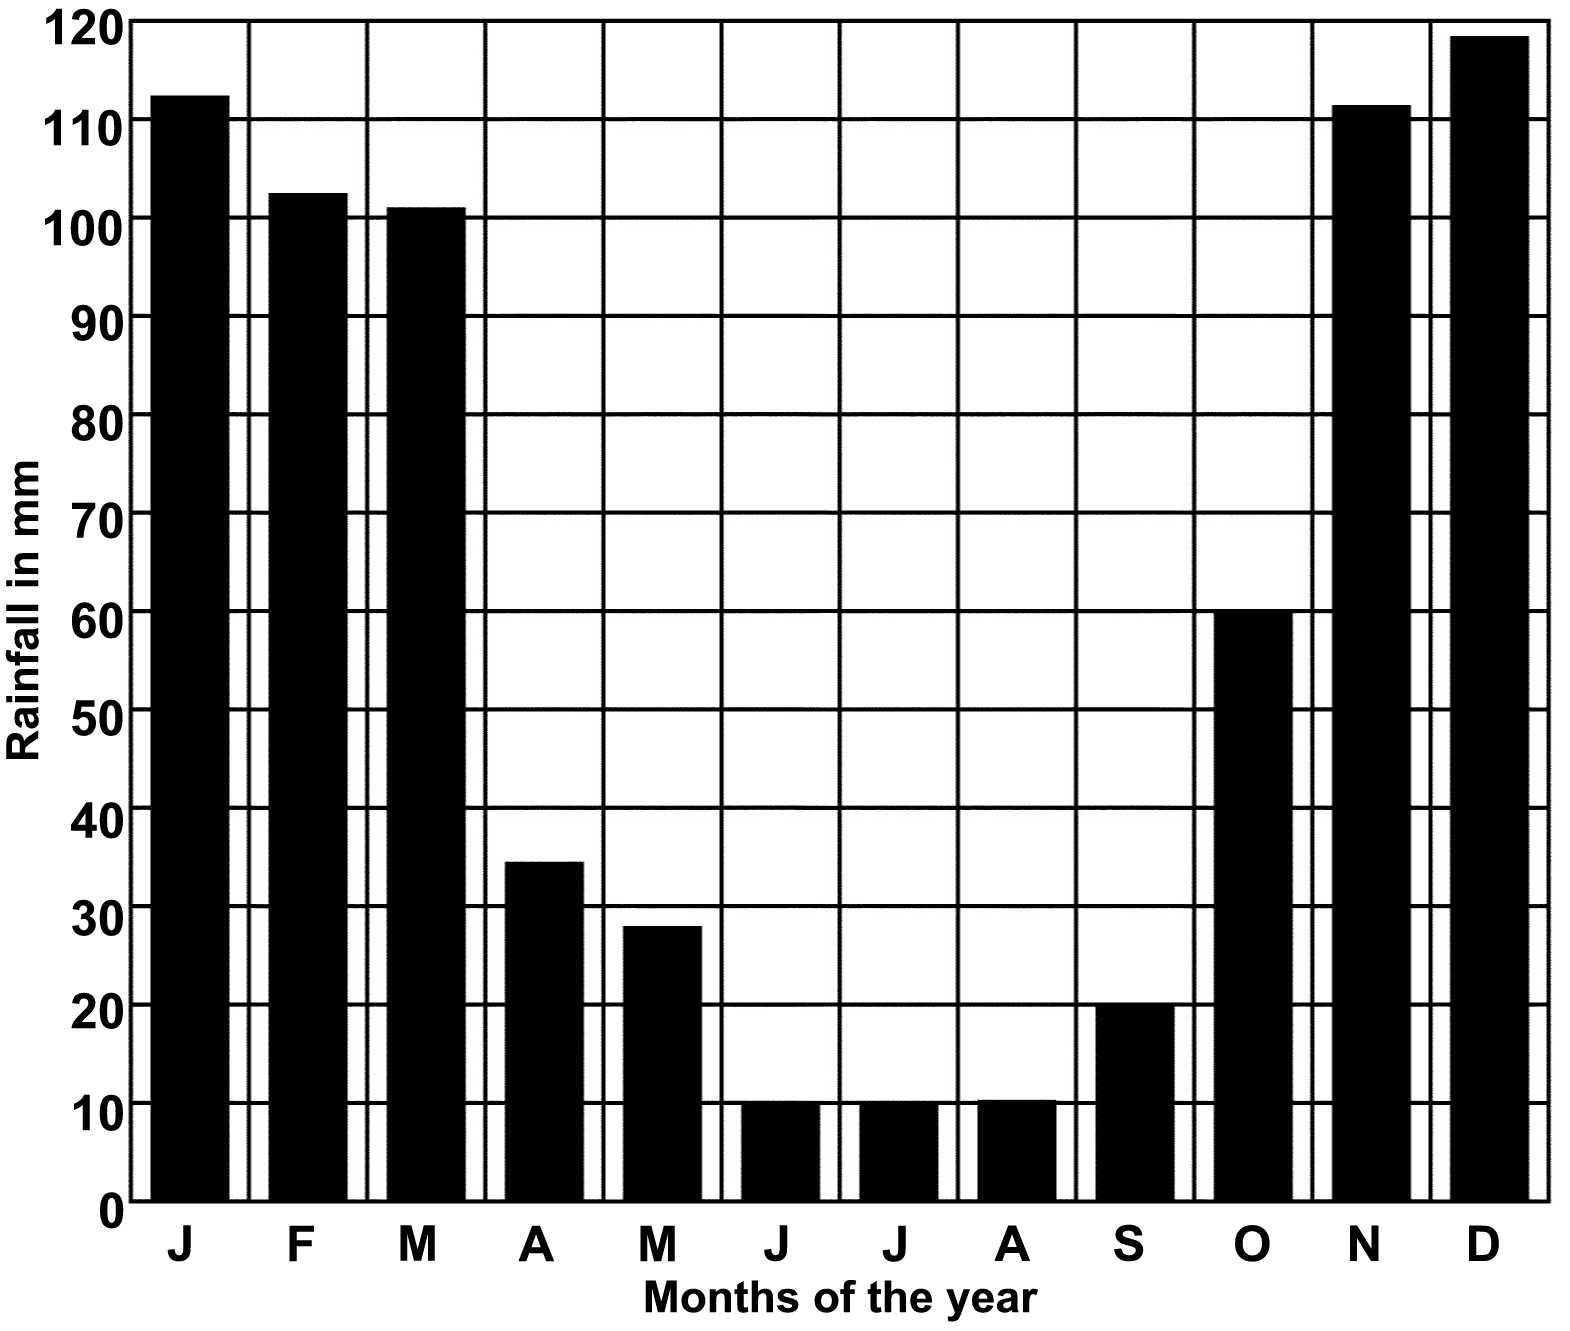
Bar Graph 1
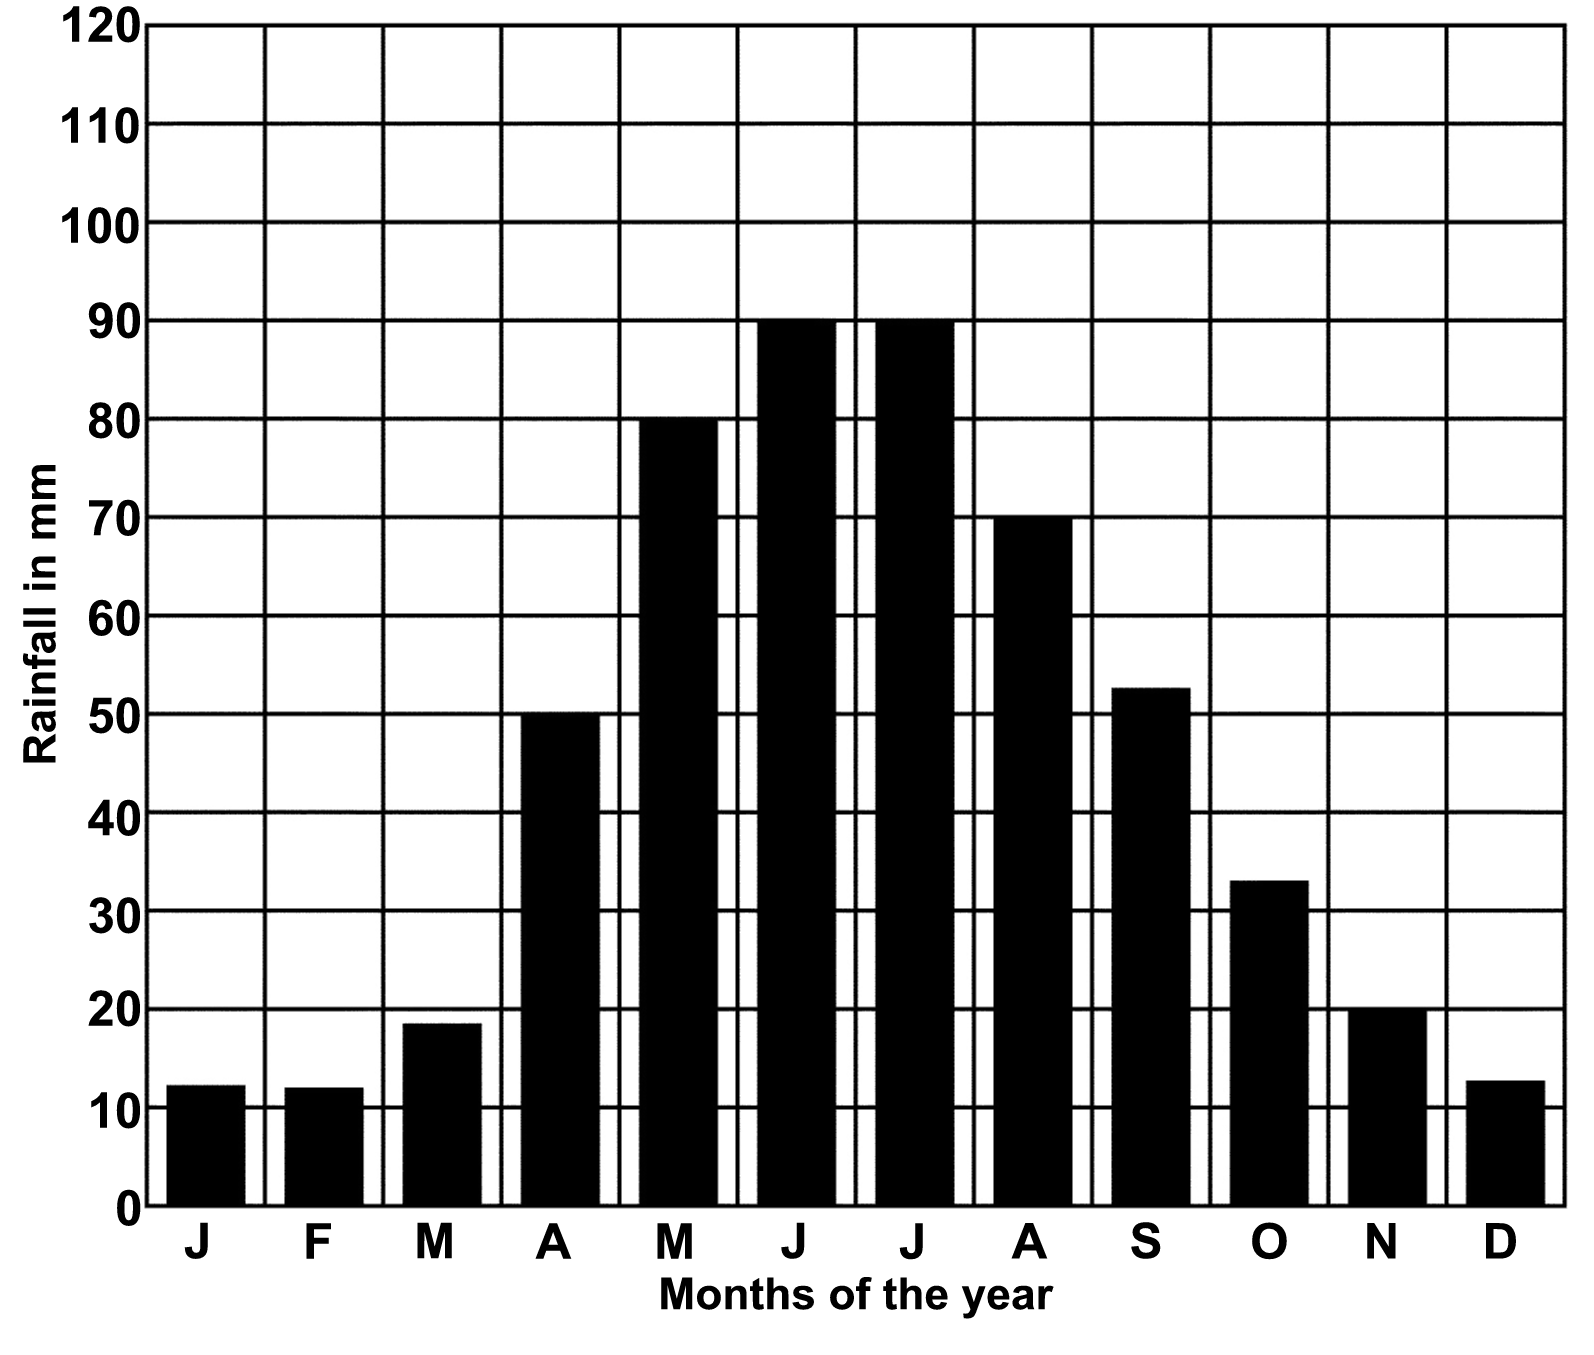
Bar Graph 2
- In what season does the most rain fall at each of the two places as depicted in the graphs?
Graph 1
Graph 2
- Would either of these places be suitable for successful maize farming? Maize requires summer rainfall of more than 400 mm per year.
- Do the graphs show any month with a rainfall of less than 30 mm?
LO 1
GEOGRAPHICAL ENQUIRY
The learner will be able to use enquiry skills to investigate geographical and environmental concepts and processes.
We know this when the learner:
1.1 with guidance, selects and uses sources of useful geographical information (including graphs, maps and fieldwork outside the classroom) [finds sources];
1.7 demonstrates knowledge and under-standing of the issue through projects, discussion, debate and charts [communicates the answer].
ACTIVITY 3

Notification Switch
Would you like to follow the 'Social sciences: geography grade 5' conversation and receive update notifications?