| << Chapter < Page | Chapter >> Page > |
The real part of the transform of the input series in Figure 3 has the same shape as the real parts of the transforms of the input series in Figure 1 and Figure 2 . This is what would be produced by adding the real parts of the transforms of the pulses in Figure 1 and Figure 2 , and then normalizing the result.
The imaginary part of the transform of the input series in Figure 3 is zero at all sample values. This is what would be produced by adding theimaginary parts of the transforms of the input series in Figure 1 and Figure 2 .
(Recall that the values in the imaginary parts of the two earlier transforms had the same magnitude but opposite signs).
Thus, Figure 1 , Figure 2 , and Figure 3 demonstrate that the transform of the sum of two or more input series is equal to the sum of the transforms ofthe individual input series. The Fourier transform is a linear transform.
The real part of the transform of a single real sample with a shift relative to the origin has the shape of a cosine curve with a period that isproportional to the reciprocal of the shift. Negative sample values produce cosine curves with negative amplitudes.
A pulse of this type is often referred to an impulse.
The imaginary part of the transform of an impulse with a shift relative to the origin has the shape of a sine curve with a period that isproportional to the reciprocal of the shift. Negative sample values produce sine curves with negative amplitudes.
The magnitude of the transform is the square root of the sum of the squares of the real and imaginary parts at each output sample point. For thecase of a single input sample with a shift, that magnitude is constant for all output sample points and is proportional to the absolute value of thesample.
The above facts are illustrated in Figure 4 , Figure 5 , Figure 6 , and Figure 7 .
| Figure 4. Transform of an impulse with no shift. |
|---|
 |
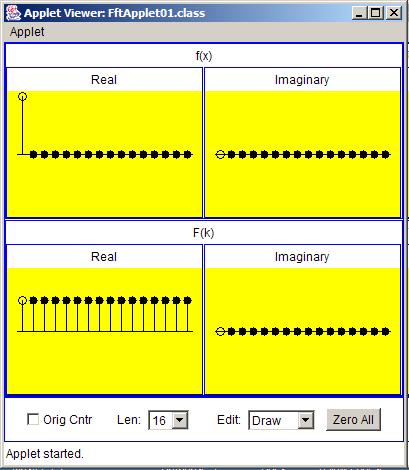
Figure 4 shows the transform of an impulse with a shift of zero relative to the origin.
(Note that in this series of figures, the origin was moved from the center to the left end. Once again, the sample with the empty circlerepresents the origin.)
Although it isn't obvious, the real part of the transform in Figure 4 has the shape of a cosine curve with a period that is the reciprocal of the shift.Because the shift is zero, the period of the cosine curve is infinite, producing real values that are constant at all output sample values.
Similarly, the imaginary part of the transform in Figure 4 has a shape that is a sine curve with an infinite period. Thus, it is zero at all output samplevalues.
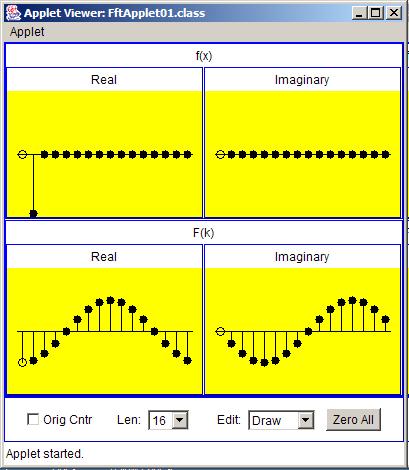
Figure 5 shows the transform of an impulse with a negative value and a shift of one sample interval relative to the origin.
| Figure 5. Transform of an impulse with a shift equal to one sample interval and a negative value. |
|---|
 |
The shape of the real part of the transform output is an upside down cosine curve. It is upside down because it has a negative amplitude. This is caused by the fact that the input sample has a negative value.

Notification Switch
Would you like to follow the 'Digital signal processing - dsp' conversation and receive update notifications?