| << Chapter < Page | Chapter >> Page > |

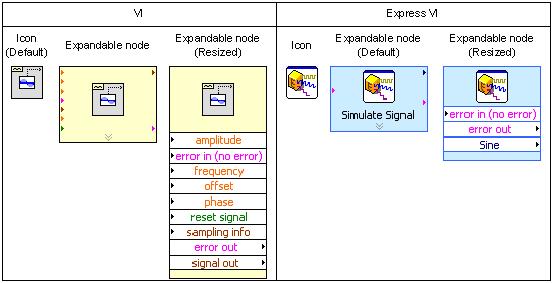
One can display subVIs or Express VIs as icons or expandable nodes. If a subVI is displayed as an expandable node, the background appears yellow. Icons can be used to save space in a block diagram and expandable nodes can be used to achieve easier wiring or better readability. One can resize expandable nodes to show their connection nodes more clearly. Three appearances of a VI/Express VI are shown in [link] .

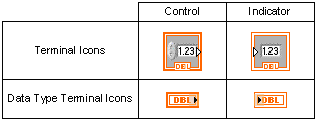
Front panel objects are displayed as terminal icons in a block diagram. A terminal icon exhibits an input or output as well as its data type. [link] shows two terminal icon examples consisting of a double precision numerical control and indicator. As shown in this figure, one can display terminal icons as data type terminal icons to conserve space in a block diagram.

Wires transfer data from one node to another in a block diagram. Based on the data type of a data source, the color and thickness of its connecting wires change.
Wires for the basic data types used in LabVIEW are shown in [link] . In addition to the data types shown in this figure, there are some other specific data types. For example, the dynamic data type is always used for Express VIs, and the waveform data type, which corresponds to the output from a waveform generation VI, is a special cluster of waveform components incorporating trigger time, time interval and data value.

A structure is represented by a graphical enclosure. The graphical code enclosed in the structure gets repeated or executed conditionally. A loop structure is equivalent to a for loop or a while loop statement in text-based programming languages, while a case structure is equivalent to an if-else statement.
A for loop structure is used to perform repetitions. As illustrated in
[link] , the displayed border indicates a
for loop structure, where the count terminal
![]() represents the number of times the loop is to be repeated. It is set by wiring a value from outside of the loop to it. The iteration terminal
represents the number of times the loop is to be repeated. It is set by wiring a value from outside of the loop to it. The iteration terminal
![]() denotes the number of completed iterations, which always starts at zero.
denotes the number of completed iterations, which always starts at zero.

A
while loop structure allows repetitions depending on a condition (see
[link] ). The conditional terminal
![]() initiates a stop if the condition is true. Similar to a
for loop , the iteration terminal
initiates a stop if the condition is true. Similar to a
for loop , the iteration terminal
![]() provides the number of completed iterations, always starting at zero.
provides the number of completed iterations, always starting at zero.

A
case structure (see
[link] ) allows the running of different sets of operations depending on the value it receives through its selector terminal, which is indicated by
![]() . In addition to Boolean type, the input to a selector terminal can be of integer, string, or enumerated type. This input determines which case to execute. The case selector
. In addition to Boolean type, the input to a selector terminal can be of integer, string, or enumerated type. This input determines which case to execute. The case selector
![]() shows the status being executed. Cases can be added or deleted as needed.
shows the status being executed. Cases can be added or deleted as needed.

An array represents a group of elements having the same data type. An array consists of data elements having a dimension up to . For example, if a random number is generated in a loop, it is appropriate to build the output as an array because the length of the data element is fixed at 1 and the data type is not changed during iterations.
Similar to the structure data type in text-based programming languages, a cluster consists of a collection of different data type elements. With clusters, one can reduce the number of wires on a block diagram by bundling different data type elements together and passing them to only one terminal. One can add or extract an individual element to or from a cluster by using the cluster functions such as Bundle by Name and Unbundle by Name .
VIs can be debugged as they run by checking values on wires with the Probe tool. Note that the Probe tool can be accessed only in a block diagram window.
With the Probe tool, breakpoints and execution highlighting, one can identify the source of an incorrect or an unexpected outcome. To visualize the flow of data during program execution, a breakpoint can be used to pause the execution of a VI at a specific location.
Timing and memory usage information – in other words, how long a VI takes to run and how much memory it consumes – can be gathered with the Profile tool. It is required to make sure that a VI is stopped before setting up a Profile window.
An effective way to become familiar with LabVIEW programming is to review examples. In the lab that follows, we explore most of the key LabVIEW programming features by building simple VIs.
Containers and Decoration tools can be used to organize front panel controls and indicators. Container tools are grouped in the Containers pallete (Controls → Modern → Containers → Classic → Classic Containers) and Decoration tools are grouped in the Decorations pallete (Controls → Modern → Decorations) .
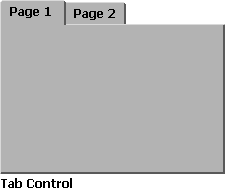
One can use Tab Control (Controls → Modern → Containers → Tab Control → Classic → Classic Containers → Tab Control) to display various controls and indicators within a limited screen area. This feature helps one to organize controls and indicators under different tabs as illustrated in [link] . To add more tabs or delete tabs, right-click the border area and choose one of the following options: Add Page After , Add Page Before , Duplicate Page or Remove Page .


Notification Switch
Would you like to follow the 'An interactive approach to signals and systems laboratory' conversation and receive update notifications?