| << Chapter < Page | Chapter >> Page > |
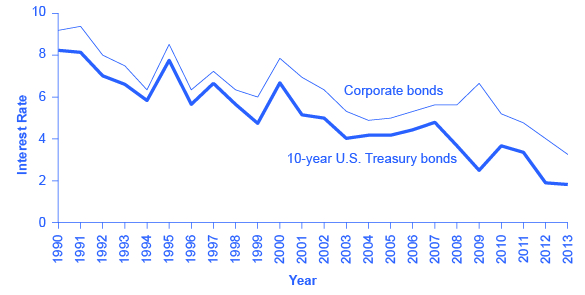
[link] shows bond yield for two kinds of bonds: 10-year Treasury bonds (which are officially called “notes”) and corporate bonds issued by firms that have been given an AAA rating as relatively safe borrowers by Moody’s , an independent firm that publishes such ratings. Even though corporate bonds pay a higher interest rate, because firms are riskier borrowers than the federal government, the rates tend to rise and fall together. Treasury bonds typically pay more than bank accounts, and corporate bonds typically pay a higher interest rate than Treasury bonds.

The bottom line for bonds: rate of return—low to moderate, depending on the risk of the borrower; risk—low to moderate, depending on whether interest rates in the economy change substantially after the bond is issued; liquidity—moderate, because the bond needs to be sold before the investor regains the cash.
As stated earlier, the rate of return on a financial investment in a share of stock can come in two forms: as dividends paid by the firm and as a capital gain achieved by selling the stock for more than you paid. The range of possible returns from buying stock is mind-bending. Firms can decide to pay dividends or not. A stock price can rise to a multiple of its original price or sink all the way to zero. Even in short periods of time, well-established companies can see large movements in the price of their stock. For example, in July 1, 2011, Netflix stock peaked at $295 per share; one year later, on July 30, 2012, it was at $53.91 per share; in 2015, it had recovered to $414. When Facebook went public, its shares of stock sold for around $40 per share, but in 2015, they were selling for slightly over $83.
The reasons why stock prices fall and rise so abruptly will be discussed below, but first you need to know how we measure stock market performance. There are a number of different ways of measuring the overall performance of the stock market, based on averaging the stock prices of different subsets of companies. Perhaps the best-known measure of the stock markets is the Dow Jones Industrial Average, which is based on the stock prices of 30 large U.S. companies. Another gauge of stock market performance, the Standard&Poor’s 500, follows the stock prices of the 500 largest U.S. companies. The Wilshire 5000 tracks the stock prices of essentially all U.S. companies that have stock the public can buy and sell.
Other measures of stock markets focus on where stocks are traded. For example, the New York Stock Exchange monitors the performance of stocks that are traded on that exchange in New York City. The Nasdaq stock market includes about 3,600 stocks, with a concentration of technology stocks. [link] lists some of the most commonly cited measures of U.S. and international stock markets.

Notification Switch
Would you like to follow the 'Principles of economics' conversation and receive update notifications?