| << Chapter < Page | Chapter >> Page > |
0. Background
1. Sine and Cosine Waves
2. Trapezoid Rule for estimating area
3. Fourier Method for decomposing signals
4. Spectrogram application to analyzing brain waves
Signals are sent through the brain using both chemical and electrical means. The synchronized electrical activity of individual neurons adds up to something big enough to detect on from outside the head. To measure it, we use a set of electrical nodes called an electroencephalogam (EEG). The measured activity reflects different states of the brain which in turn tell us something about the mindset of the person. Our goal in this module is to decompose an EEG signal into its different frequencies, which is intuitively the most meaningful piece of information.
Brainwaves have complex shapes that are not easily interpreted. In order to study these waves, we need to develop some mathematical tools that will tell us about different waves. To outline, we begin by talking about pure (sine or cosine) waves, then move to the trapezoid rule for estimating area under a curve. Next, we develop Fourier analysis for picking out the frequencies in a jumbled signal, and finally use these tools to create spectrograms, which allow us to track different frequencies over time.
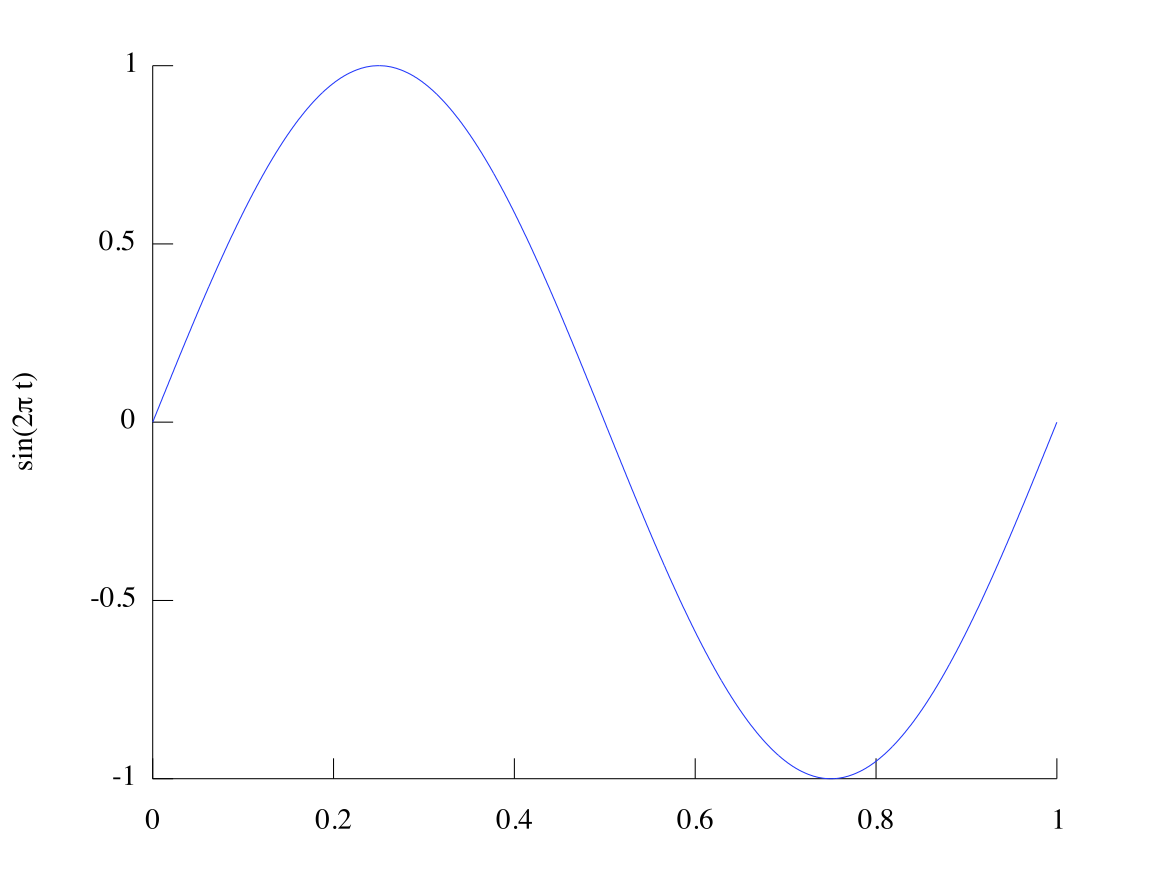
The sine wave is a mathematical function. It describes many physical phenomena, including sound waves and oscillation. It looks just like a wave. MATLAB uses the
sin function to make sin waves. For example, to make Figure 1, we use the code:
>>t = 0:.01:1;>>y = sin(2*pi*t);>>plot(t,y);
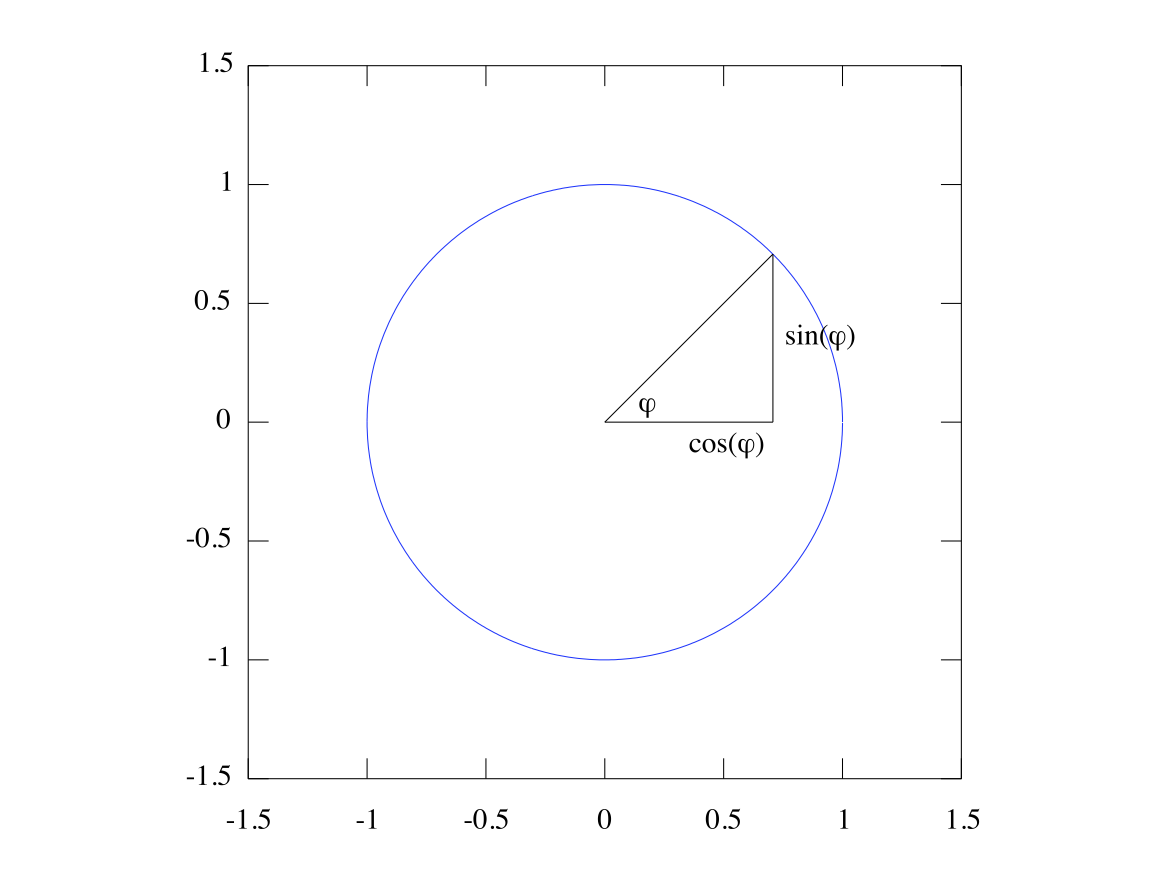
The sine wave is defined by the lengths and angles of a triangle. Run
sincirc.m (copied below) to see how the sine and cosine values relate to the angle
of the triangle. As you can see, if
is the angle of a right triangle with hypotenuse 1 (illustrated by the circle) ,
is the height of the triangle and
is the base of it:


% sincirc.m
%% sincirc.m illustrates the relation of the sin and cosine waves to the circle.

%define parametersNturns = 2;
steps_per_turn = 9;step_inc = 2*pi/steps_per_turn;

%set up points for circlecirc_x = cos(0:.01:2*pi);
circ_y = sin(0:.01:2*pi);axis equal

%loop over triangles with different anglesfor n = 1:Nturns * steps_per_turn;
    phi = n * step_inc + pi/4;%plot circle, then triangle, then text
    plot(circ_x, circ_y);axis([-1 1 -1 1] * 1.5);line([0 cos(phi)], [0 sin(phi)]);
    line([1 1]* cos(phi), [0 sin(phi)]);line([0 cos(phi)], [0 0]);
    text(cos(phi)/2 , -.1*sign(sin(phi)),'cos(\varphi)')text(cos(phi) + .1*(sign(cos(phi))-.5), sin(phi)/2, 'sin(\varphi)')
    text(cos(phi)*.2, sin(phi)*.1,'\varphi');pause(.5);
end
The sin wave has three primary characteristics:

Notification Switch
Would you like to follow the 'The art of the pfug' conversation and receive update notifications?