| << Chapter < Page | Chapter >> Page > |
The data are the colors of backpacks. Again, you sample the same five students. One student has a red backpack, two students have black backpacks, one student has a green backpack, and one student has a gray backpack. The colors red, black, black, green, and gray are qualitative data.
The data are the colors of houses. You sample five houses. The colors of the houses are white, yellow, white, red, and white. What type of data is this?
qualitative data
You may collect data as numbers and report it categorically. For example, the quiz scores for each student are recorded throughout the term. At the end of the term, the quiz scores are reported as A, B, C, D, or F.
Work collaboratively to determine the correct data type (quantitative or qualitative). Indicate whether quantitative data are continuous or discrete. Hint: Data that are discrete often start with the words "the number of."
Items a, e, f, k, and l are quantitative discrete; items d, j, and n are quantitative continuous; items b, c, g, h, i, and m are qualitative.
Determine the correct data type (quantitative or qualitative) for the number of cars in a parking lot. Indicate whether quantitative data are continuous or discrete.
quantitative discrete
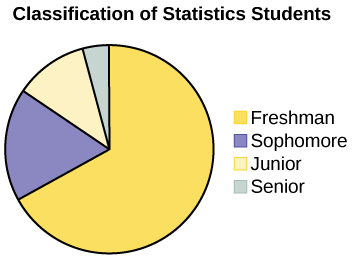
A statistics professor collects information about the classification of her students as freshmen, sophomores, juniors, or seniors. The data she collects are summarized in the pie chart [link] . What type of data does this graph show?

This pie chart shows the students in each year, which is qualitative data .
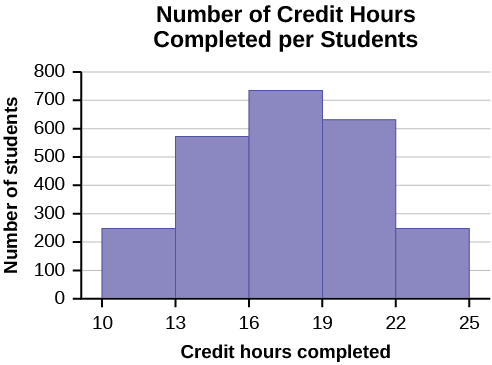
The registrar at State University keeps records of the number of credit hours students complete each semester. The data he collects are summarized in the histogram. The class boundaries are 10 to less than 13, 13 to less than 16, 16 to less than 19, 19 to less than 22, and 22 to less than 25.

What type of data does this graph show?
A histogram is used to display quantitative data: the numbers of credit hours completed. Because students can complete only a whole number of hours (no fractions of hours allowed), this data is quantitative discrete.
Below are tables comparing the number of part-time and full-time students at De Anza College and Foothill College enrolled for the spring 2010 quarter. The tables display counts (frequencies) and percentages or proportions (relative frequencies). The percent columns make comparing the same categories in the colleges easier. Displaying percentages along with the numbers is often helpful, but it is particularly important when comparing sets of data that do not have the same totals, such as the total enrollments for both colleges in this example. Notice how much larger the percentage for part-time students at Foothill College is compared to De Anza College.

Notification Switch
Would you like to follow the 'Introductory statistics' conversation and receive update notifications?