| << Chapter < Page | Chapter >> Page > |

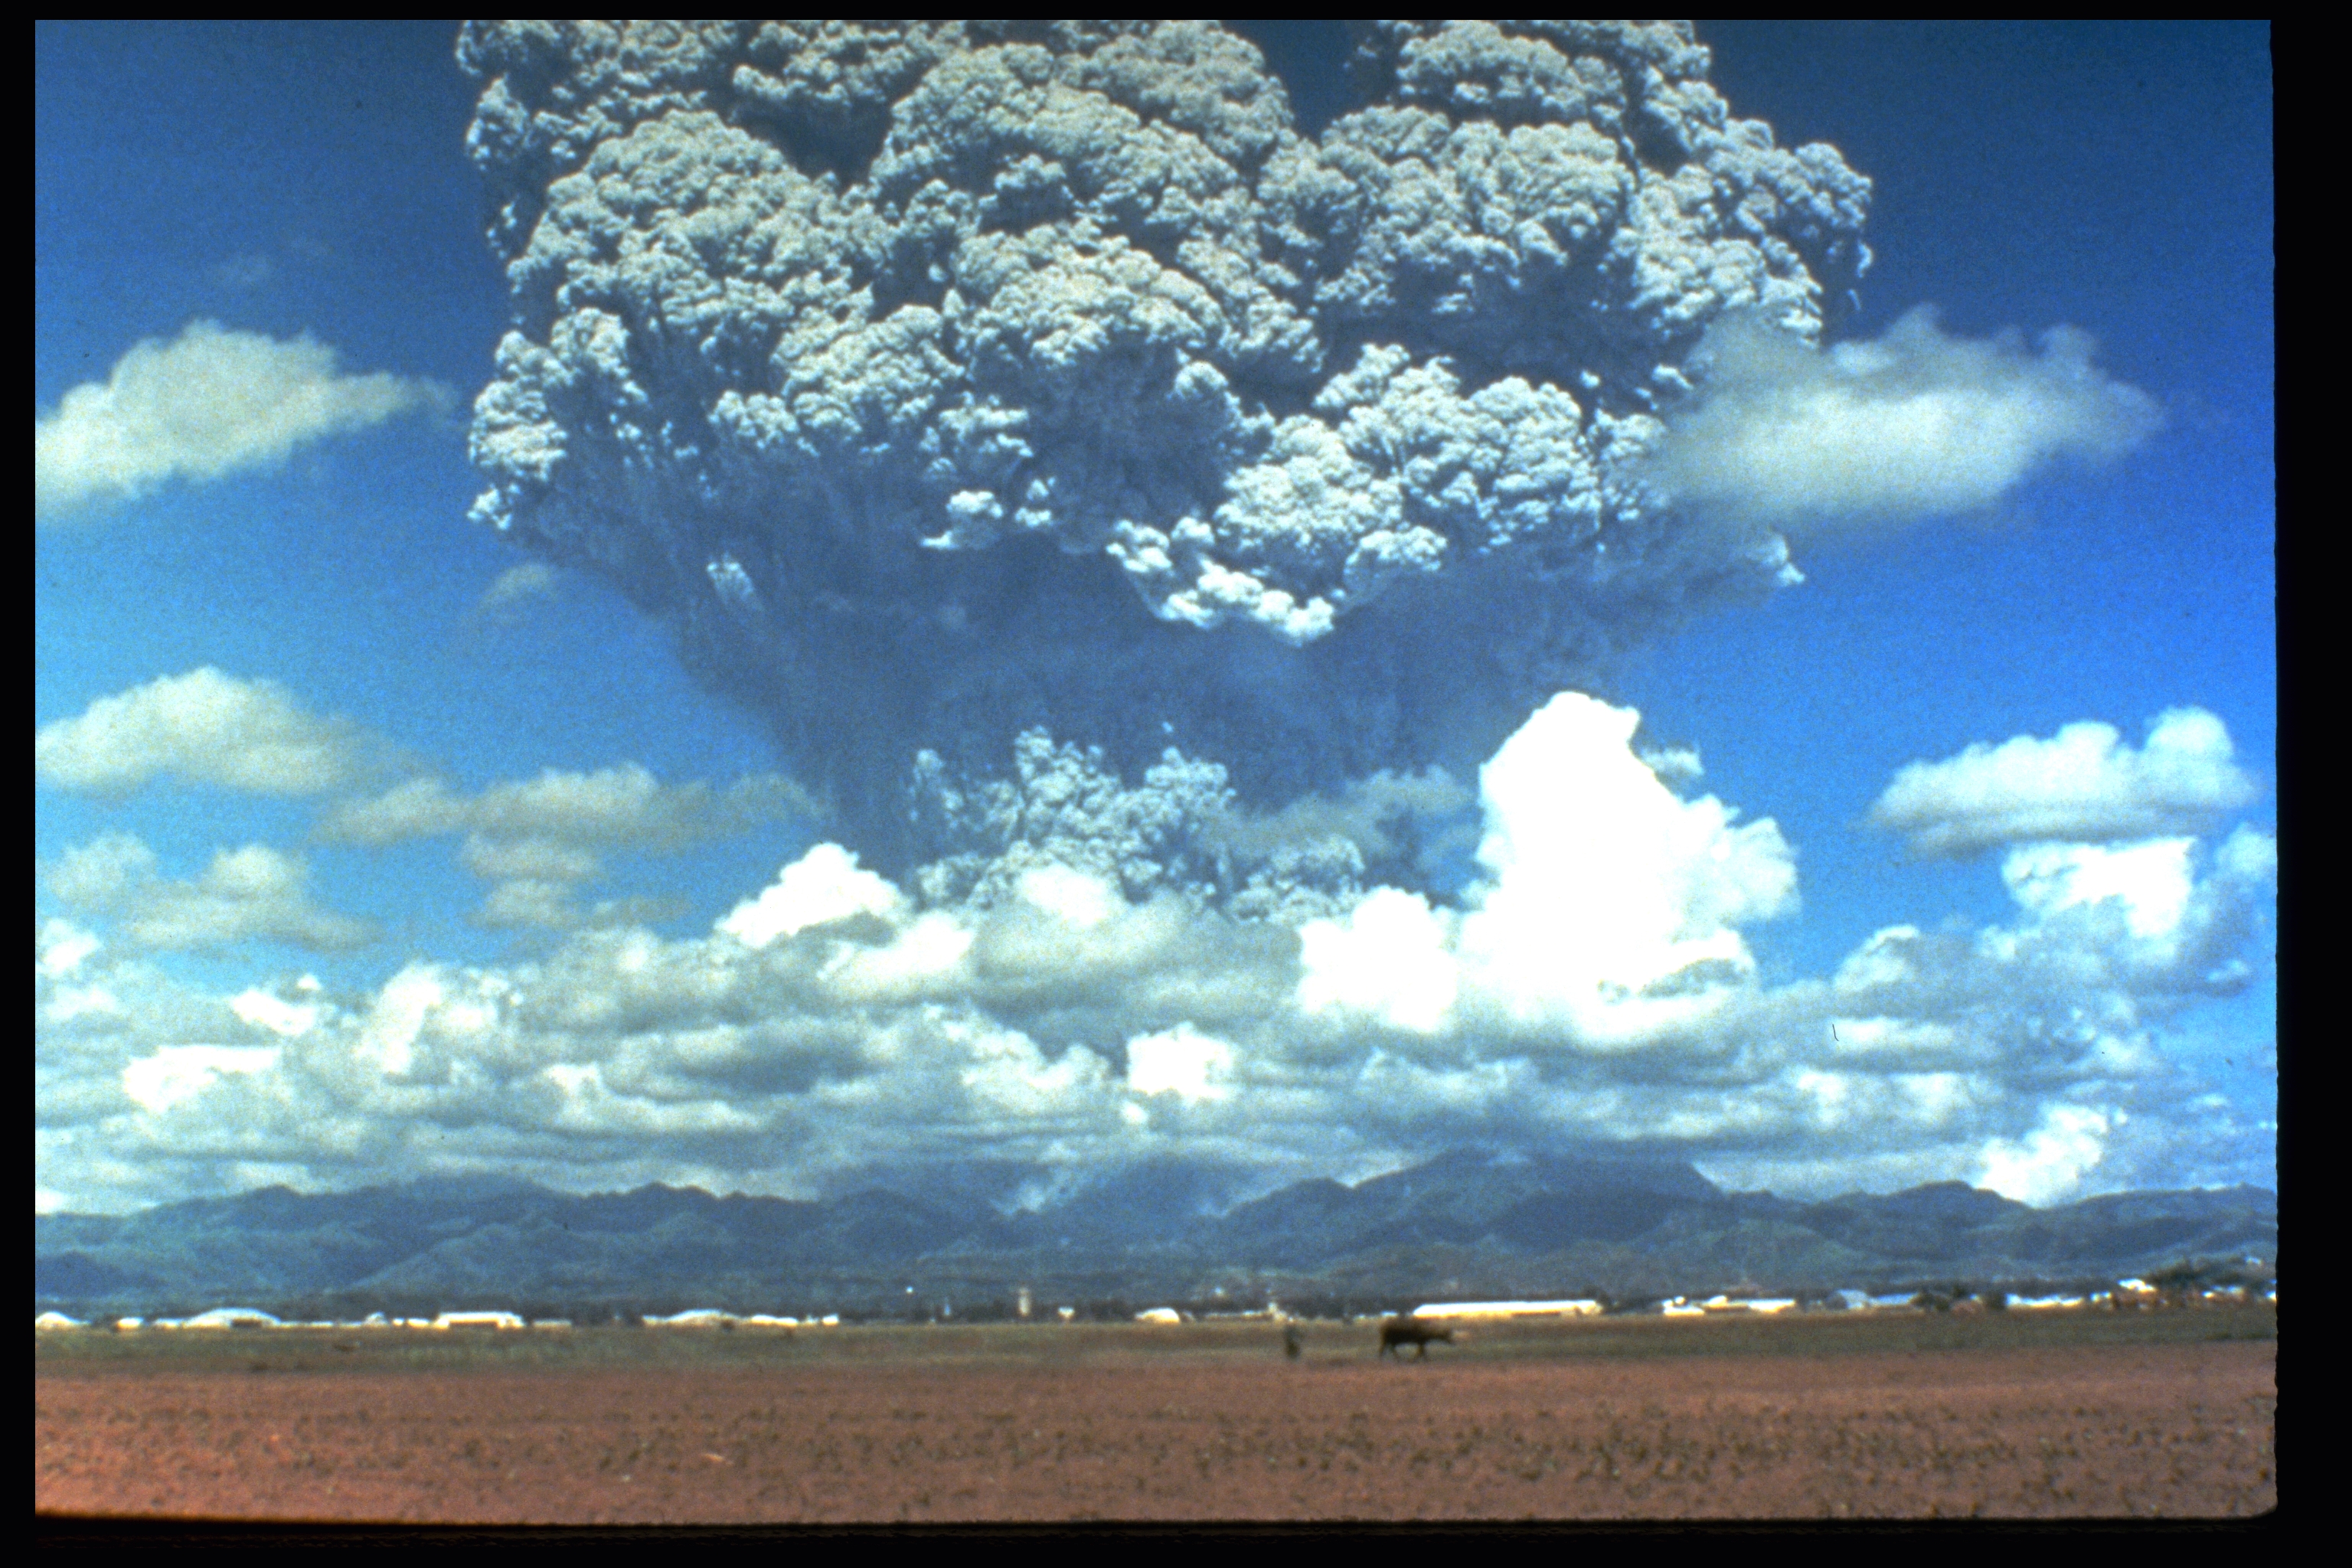
Outside of human influence, planetary albedo can also be changed by major volcanic eruptions. When volcanoes erupt, they spew enormous amounts of soot, ash, dust, sulfur, and other aerosols into the atmosphere. During major eruptions, like that of Mt. Pinatubo in 1991, some particles of this debris find their way into the stratosphere, where they reside for a few years. (see Figure Mt. Pinatubo Erupting in 1991 ) The presence of these particles high in the earth’s atmosphere acts like a shield that prevents sunlight from penetrating through the lower atmosphere to warm the earth’s surface. Instead, the energy is either absorbed by the particles or reflected and scattered away. The net effect is that large volcanic eruptions can cool the planet for a few years by changing the earth’s albedo.

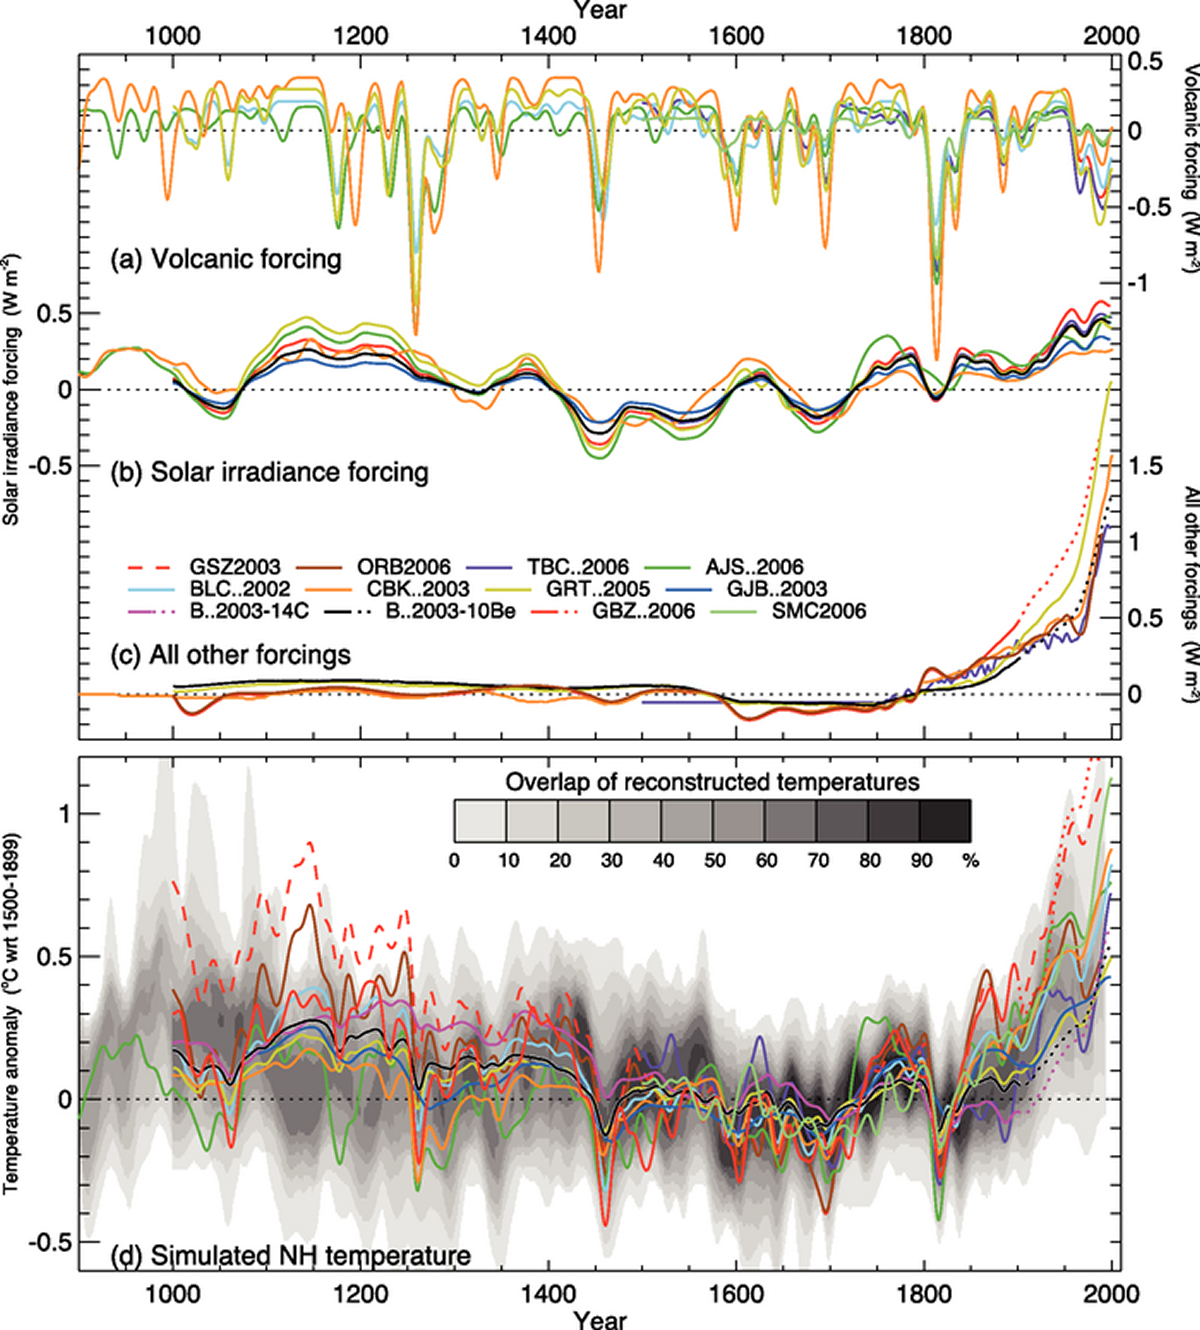
At first glance the Figure Radiative Forcings&Simulated Temperatures looks quite complicated, but let’s break this graph down to understand how changes in the sun’s output and volcanic eruptions have contributed to recent climate change. In the top panel (a), changes in the amount of energy, measured in W/m 2 , are graphed against time to show how volcanic eruptions have impacted the amount of energy the earth receives from the sun. Notice that around the year 1815, when Mt. Tambora erupted, there is a large downward spike in the plot. Now, examine the bottom panel, which shows the NH temperatures, just as Figure Northern Hemisphere Surface Air displayed, and see how the temperatures in the years following 1815 took a sharp downward turn. This is a direct consequence of the changes in albedo caused by large volcanic eruptions. Next, look at the time period between 1000 and 1300 A.D., the so-called Medieval Warm Period. In panel (b), changes in solar output are graphed against time; notice that during the Medieval Warm Period, the amount of insolation was high compared to the average. The opposite occurred during the Little Ice Age which peaked around 400 years ago.

We have ruled out the first two mechanisms (i.e., changes in albedo and insolation) as reasons for the recent increase in global temperatures. But when we look at panel (c) in Figure Radiative Forcings&Simulated Temperatures , we notice that the “all other forcing” curves point to a rapid increase in the amount of energy retained by the earth-atmosphere system over the last 200 years. What is responsible for the increasing tail on this graph? Have humans altered the composition of the Earth’s atmosphere to make it more efficient at absorbing the infrared radiation that would have otherwise been lost to space? Is there proof of a human enhancement to the natural greenhouse effect? Can we explain the recent warming on an anthropogenic adjustment to the greenhouse gases like carbon dioxide (CO 2 )? Is an “enhanced greenhouse effect” to blame for the fact that the top ten warmest years since the modern era of instrument measurements have occurred since 1995, as seen in Figure Annual Global Temperature Anomalies .

Notification Switch
Would you like to follow the 'Sustainability: a comprehensive foundation' conversation and receive update notifications?