| << Chapter < Page | Chapter >> Page > |
In this section we will discuss techniques using spreadsheet for exploring normal probability distributions, finding z-scores, and displaying normal distributions.
You can set up a worksheet in Excel to computer probabilities for Standard Normal Distributions.
| Function | Excel Formula | Google Spreadsheet formula |
|---|---|---|
| Returns the Standard Normal Cumulative Distribution for a specified z value based on your value of interest in relationship to the mean and standard deviation of the data set. | =norm.dist(x, mean, standard deviation, True) | =normdist(x, mean, standard deviation, 1) |
| Returns the inverse of the Standard Normal Cumulative Distribution for a specified z value. It will give you a value of interest based on the probability of interest, mean, and standard score | =norm.inv(probability, mean, standard deviation) | =norminv(probability, mean, standard deviation) |
| Returns the Standard Normal Cumulative Distribution for a specified z value based on a Standard Distribution (0 as the mean and 1 as the standard deviation) This would be equivalent to looking up a cumulative distribution value using the z-score table. | =norm.s.dist(z-score of interest,True) | =normsdist(s-score of interest) |
| Returns the inverse of the Standard Normal Cumulative Distribution. Given a probability value, it will return the specified z value based on a Standard Distribution (0 as the mean and 1 as the standard deviation) This would be equivalent to looking up a z-score on using the z-score table, when you already have a probability of interest. | =norm.s.inv(probability value of interest) | =normsinv(probability value of interest) |
Using the formulas shown in the Excel or a Google Spreadsheet can be used instead of a z-score table for homework and your project.
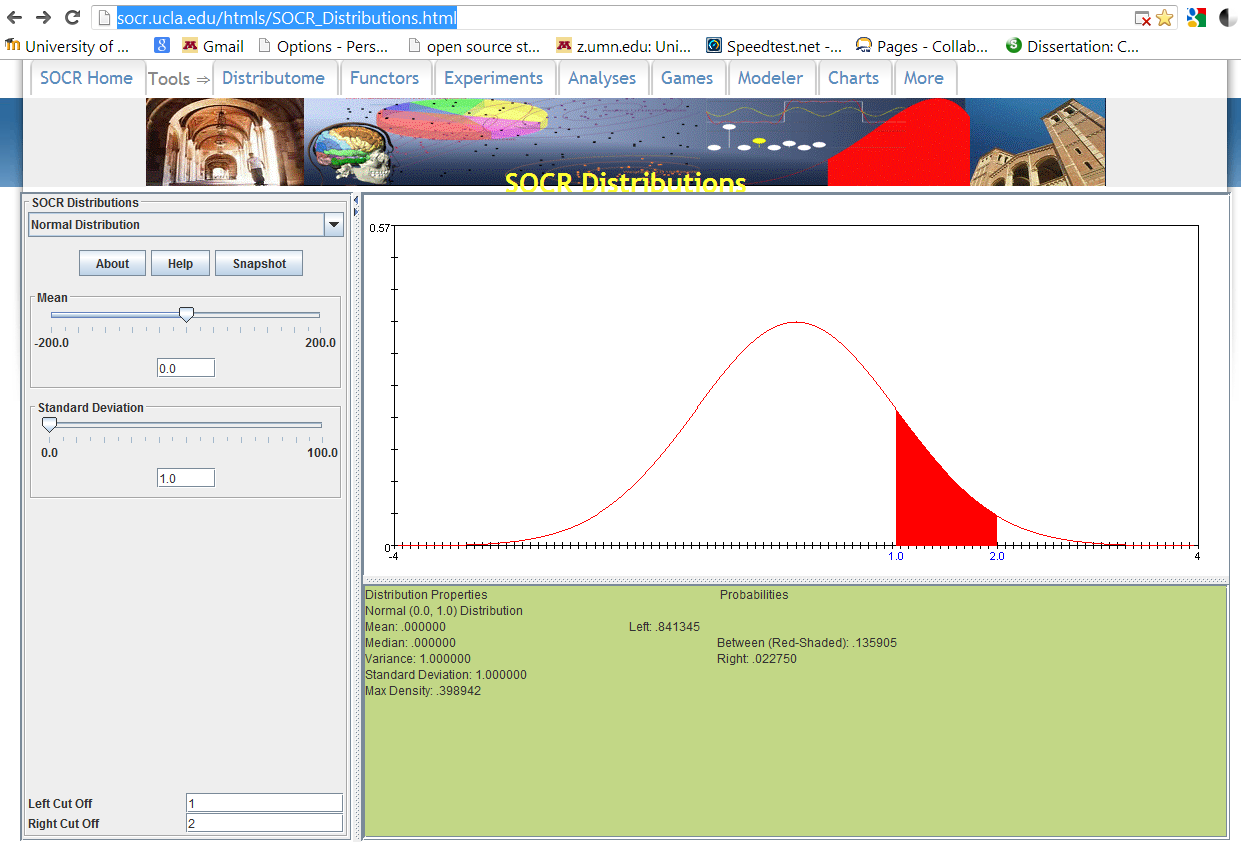
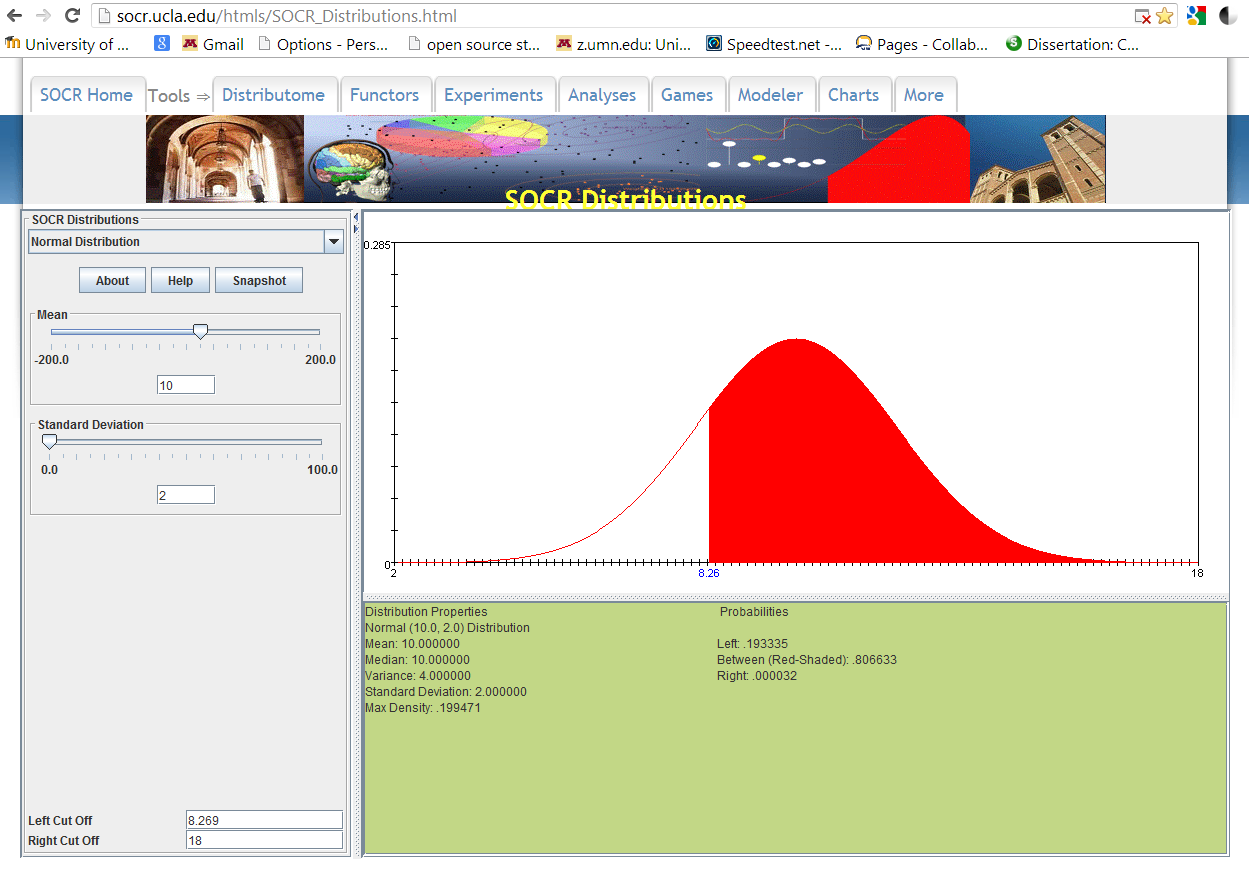
To graph normal distributions the “Statistics Online Computational Resources (SOCR)” at http://socr.ucla.edu/htmls/SOCR_Distributions.html (just as in the previous chapter) has in the dropdown menu for SOCR distribution the normal distribution. For a normal distribution, you will need to have your mean and standard deviation and again your right and left cut off values. You can enter standard scores (0 as the mean, and 1 as the standard deviation) to use this template or you can use your actual mean and standard deviation to generate a graph of the distribution and the ancillary values of interest. Below is a graph based on a standard score and a graph where the actual mean and standard deviation were used.


At your computer, try to use some of these tools to work out your homework problems or check homework that you have completed to see if the results are the same or similar.

Notification Switch
Would you like to follow the 'Collaborative statistics using spreadsheets' conversation and receive update notifications?