| << Chapter < Page | Chapter >> Page > |
By the end of this section, you will be able to:
Because of the lack of competition, monopolies tend to earn significant economic profits. These profits should attract vigorous competition as described in Perfect Competition , and yet, because of one particular characteristic of monopoly, they do not. Barriers to entry are the legal, technological, or market forces that discourage or prevent potential competitors from entering a market. Barriers to entry can range from the simple and easily surmountable, such as the cost of renting retail space, to the extremely restrictive. For example, there are a finite number of radio frequencies available for broadcasting. Once the rights to all of them have been purchased, no new competitors can enter the market.
In some cases, barriers to entry may lead to monopoly. In other cases, they may limit competition to a few firms. Barriers may block entry even if the firm or firms currently in the market are earning profits. Thus, in markets with significant barriers to entry, it is not true that abnormally high profits will attract new firms, and that this entry of new firms will eventually cause the price to decline so that surviving firms earn only a normal level of profit in the long run.
There are two types of monopoly, based on the types of barriers to entry they exploit. One is natural monopoly , where the barriers to entry are something other than legal prohibition. The other is legal monopoly , where laws prohibit (or severely limit) competition.
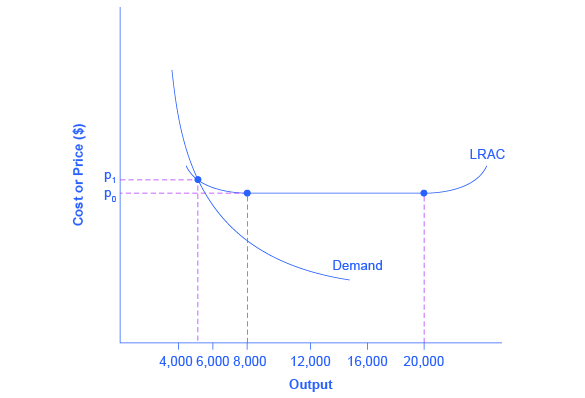
Economies of scale can combine with the size of the market to limit competition. (This theme was introduced in Cost and Industry Structure ). [link] presents a long-run average cost curve for the airplane manufacturing industry. It shows economies of scale up to an output of 8,000 planes per year and a price of P 0 , then constant returns to scale from 8,000 to 20,000 planes per year, and diseconomies of scale at a quantity of production greater than 20,000 planes per year.
Now consider the market demand curve in the diagram, which intersects the long-run average cost (LRAC) curve at an output level of 6,000 planes per year and at a price P 1 , which is higher than P 0 . In this situation, the market has room for only one producer. If a second firm attempts to enter the market at a smaller size, say by producing a quantity of 4,000 planes, then its average costs will be higher than the existing firm, and it will be unable to compete. If the second firm attempts to enter the market at a larger size, like 8,000 planes per year, then it could produce at a lower average cost—but it could not sell all 8,000 planes that it produced because of insufficient demand in the market.


Notification Switch
Would you like to follow the 'Principles of economics' conversation and receive update notifications?