| << Chapter < Page | Chapter >> Page > |
Suppose you have set the goal of making an A in your math class. If your class grades consist of 4 tests, and you have made a 98, 80, and 90 on your first three tests, what do you need to make on your last test so that the mean of your grades is 90?
(for the advanced) Suppose that, for the same class, you have already computed the mean of the first three tests when you receive your fourth test grade. Instead of computing the mean of all four tests from scratch, it's possible to update the mean that you've already computed. Write a Matlab code that takes two inputs, the mean of your first three tests and the grade of your fourth test, and computes the mean of all four tests.
As you saw in "Example 2.2" , the mean is not always representative of the data, and other measures are needed to analyze the spread of the data. The variance is a measure of the distance of each number from the mean. Given a vector x of n numbers and mean value the variance of x is given by
The standard deviation of the data is related to the variance and is given by
You can compute the variance and standard deviation of x in Matlab by typing the commands var(x) and std(x).
Consider the vector given in "Example 2.1" , x = [1, 7, 2, 5, 9, 6]. Recall that the mean of x = 5.
Consider the data from "Example 2.2" , where the mean = 300. The variance is
and the standard deviation is
Because the standard deviation is considerably larger than the mean, the variance tells us that the mean is not very representative of the data.
Compute the variance and standard deviation of y = [3, 8, 2, 5, 5, 7], using both the formulas and the Matlab commands.
Suppose that in the situation of "Example 2.2" , there are 50 general exmployees instead of 16. Compute the mean and variance of the daily salary. Is the mean more or less representative of the data than it was in Example 2.2?
Although the mean, variance, and standard deviation provide information about the data, it is often useful to visualize the data. A histogram is a tool that allows you to visualize the proportion of numbers that fall within a given bin, or interval. To compute the histogram of a set of data, x , follow the algorithm below.
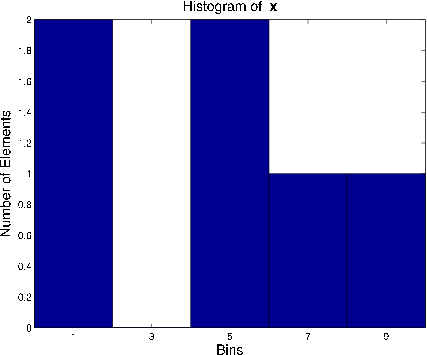
Consider again the vector from "Example 2.1" , x = [1, 7, 2, 5, 9, 6]. Using a bin size = 2, there are 5 bins.

In Matlab, you can plot the histogram of a vector x by typing hist(x). Matlab will automatically use 10 bins. If you'd like to specify the bin centers, type hist(x,c), where c is a vector of bin centers. The histogram of "Example 4.1" was generated by the Matlab command hist(x, [1, 3, 5, 7, 9]).
Plot the histogram of the vector y = [3, 8, 2, 5, 5, 7], both on paper and in Matlab.
Plot the histogram of the daily salaries from "Example 2.2" . For this example, does the histogram or the mean give you a better idea of what salary you would be making if you got the job?

Notification Switch
Would you like to follow the 'The art of the pfug' conversation and receive update notifications?