| << Chapter < Page | Chapter >> Page > |


[link] displays the 2006 commercial energy mix by country for some of the prime energy users in the world. While non-renewable sources dominate, some countries get a sizeable percentage of their electricity from renewable resources. For example, about 67% of New Zealand’s electricity demand is met by hydroelectric. Only 10% of the U.S. electricity is generated by renewable resources, primarily hydroelectric. It is difficult to determine total contributions of renewable energy in some countries with a large rural population, so these percentages in this table are left blank.
| Country | Consumption, in EJ (10 18 J) | Oil | Natural Gas | Coal | Nuclear | Hydro | Other Renewables | Electricity Use per capita (kWh/yr) | Energy Use per capita (GJ/yr) |
|---|---|---|---|---|---|---|---|---|---|
| Australia | 5.4 | 34% | 17% | 44% | 0% | 3% | 1% | 10000 | 260 |
| Brazil | 9.6 | 48% | 7% | 5% | 1% | 35% | 2% | 2000 | 50 |
| China | 63 | 22% | 3% | 69% | 1% | 6% | 1500 | 35 | |
| Egypt | 2.4 | 50% | 41% | 1% | 0% | 6% | 990 | 32 | |
| Germany | 16 | 37% | 24% | 24% | 11% | 1% | 3% | 6400 | 173 |
| India | 15 | 34% | 7% | 52% | 1% | 5% | 470 | 13 | |
| Indonesia | 4.9 | 51% | 26% | 16% | 0% | 2% | 3% | 420 | 22 |
| Japan | 24 | 48% | 14% | 21% | 12% | 4% | 1% | 7100 | 176 |
| New Zealand | 0.44 | 32% | 26% | 6% | 0% | 11% | 19% | 8500 | 102 |
| Russia | 31 | 19% | 53% | 16% | 5% | 6% | 5700 | 202 | |
| U.S. | 105 | 40% | 23% | 22% | 8% | 3% | 1% | 12500 | 340 |
| World | 432 | 39% | 23% | 24% | 6% | 6% | 2% | 2600 | 71 |
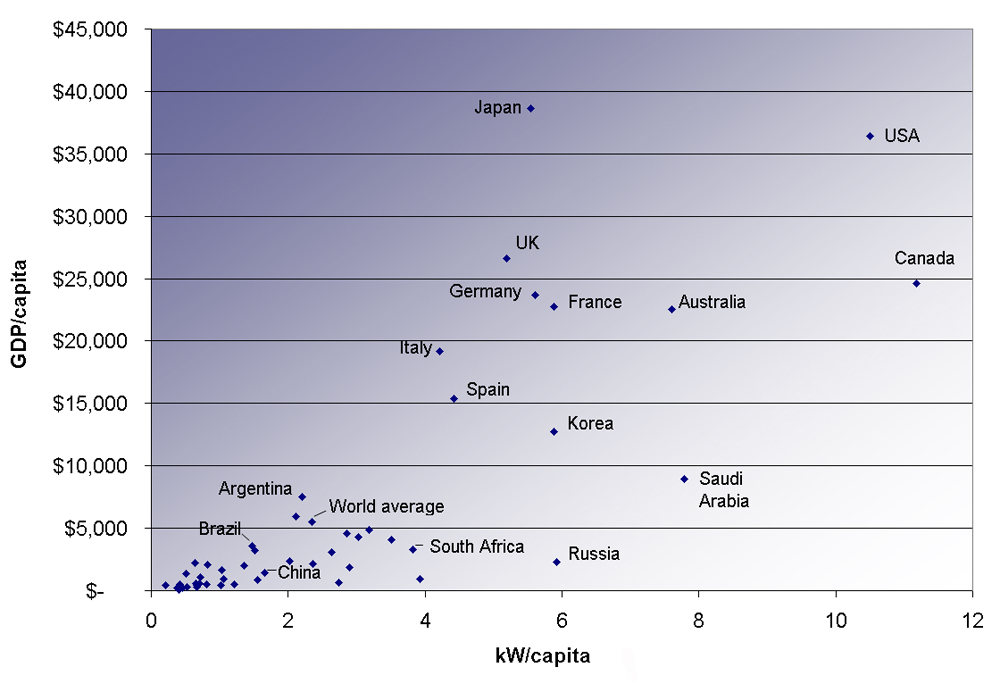
The last two columns in this table examine the energy and electricity use per capita. Economic well-being is dependent upon energy use, and in most countries higher standards of living, as measured by GDP (gross domestic product) per capita, are matched by higher levels of energy consumption per capita. This is borne out in [link] . Increased efficiency of energy use will change this dependency. A global problem is balancing energy resource development against the harmful effects upon the environment in its extraction and use.

As we finish this chapter on energy and work, it is relevant to draw some distinctions between two sometimes misunderstood terms in the area of energy use. As has been mentioned elsewhere, the “law of the conservation of energy” is a very useful principle in analyzing physical processes. It is a statement that cannot be proven from basic principles, but is a very good bookkeeping device, and no exceptions have ever been found. It states that the total amount of energy in an isolated system will always remain constant. Related to this principle, but remarkably different from it, is the important philosophy of energy conservation. This concept has to do with seeking to decrease the amount of energy used by an individual or group through (1) reduced activities (e.g., turning down thermostats, driving fewer kilometers) and/or (2) increasing conversion efficiencies in the performance of a particular task—such as developing and using more efficient room heaters, cars that have greater miles-per-gallon ratings, energy-efficient compact fluorescent lights, etc.
Since energy in an isolated system is not destroyed or created or generated, one might wonder why we need to be concerned about our energy resources, since energy is a conserved quantity. The problem is that the final result of most energy transformations is waste heat transfer to the environment and conversion to energy forms no longer useful for doing work. To state it in another way, the potential for energy to produce useful work has been “degraded” in the energy transformation. (This will be discussed in more detail in Thermodynamics .)

Notification Switch
Would you like to follow the 'Unit 5 - work and energy' conversation and receive update notifications?