| << Chapter < Page | Chapter >> Page > |
There are two ways that we can approach this analysis. If the wire is very long, we can think in terms of a deformation pulse that propagates along thewire passing by our sensors once and only once. This would fall into the category of transient analysis .
On the other hand, if the wire is shorter, we can think in terms of vibrating one end of the wire in such a way that a standing wave will develop on the wire.This is probably the easier of the two approaches to understand because you may have created standing waves on a rope as a child.
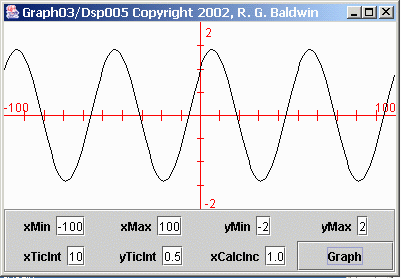
Once a standing wave is set up on the wire, it will take on an appearance very similar to the sine wave shown in Figure 1 .
| Figure 1. A standing wave on a wire. |
|---|
 |
Figure 1 represents a snapshot taken at a single instant in time. Obviously the wire doesn't remain in the position shown in Figure 1 for very long. Rather a single point on the wire will move up and down with time with the overallappearance being as shown in Figure 1 . The distance between any two positive peaks is what we would refer to as the wavelength of the standing wave.
Now consider what would happen if we were to electronically add the electrical outputs produced by the two sensors. The result would depend on thedistance between the sensors relative to the wavelength of the standing wave. For example, if the two sensors were exactly one wavelength apart, the twosensors would move up and down in unison, and the sum of the two signals would be double the signal level produced by either sensor alone. The result would bethe same as if the two sensors were located at the same place on the wire.
On the other hand, if the two sensors were exactly one-half wavelength apart, one would be going up when the other is going down, and the electrical outputfrom one would cancel the electrical output from the other. In space processing terminology, this would be referred to as a null point .
Now consider what would happen if you were to leave the two sensors in the same locations as before and do something to the wire to change the wavelengthof the standing wave. The output from the sum of the two sensors would range from zero to maximum as the wavelength relative to the sensor separation variesfrom one-half wavelength to one full wavelength. For a one-half wavelength separation, the output would be zero. For a full wavelength separation,the output would be at its maximum.
We could refer to our two sensors as a two-element array , and we could refer to the output produced by the sum of the two sensors as the responseof the array. We could plot the response versus wavelength. However, in the same sense that it is more common to plot the response of electrical filters versusfrequency (instead of period) , it is probably most common to plot the response of arrays versus wavenumber (instead of wavelength) . Therefore, in this module, we will plot the response of the array versuswavenumber.

Notification Switch
Would you like to follow the 'Digital signal processing - dsp' conversation and receive update notifications?