| << Chapter < Page | Chapter >> Page > |
Now we are going to make a major change in direction. All of the surfaces from cases 0 through 6 consisted of a few individual points located in specificgeometries in the space domain. All of the remaining points on the surface had a value of zero. This resulted in continuous (but sampled) surfaces in the wavenumber domain.
Now we are going to generate continuous (but sampled) surfaces in the space domain. We will generate these surfaces as sinusoidal surfaces (similar to a sheet of corrugated sheet metal) or the sums of sinusoidal surfaces.
Performing Fourier transforms on these surfaces will produce amplitude spectra consisting of a few non-zero points in wavenumber space with theremaining points in the spectrum having values near zero.
In order to make these amplitude spectra easier to view, I have modified the program to cause the square representing each point in the amplitude spectrum to be five pixels on each side instead of three pixels on each side. To keep theoverall size of the images under control, I reduced the width and the height of the surfaces from 41 points to 23 points.
I suspect that you have seen all the real parts, imaginary parts, and unshifted amplitude spectra that you want to see. Therefore, at this point, Iwill begin displaying only the input surface, the amplitude spectrum, and the output surface that results from performing an inverse Fourier transform on thecomplex spectrum.
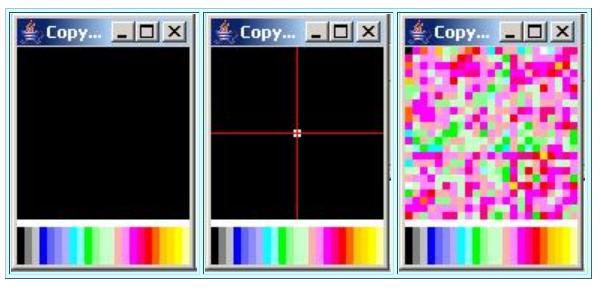
The first example in this category is shown in Figure 12 . The input surface for this example is a sinusoidal wave with a frequency of zero. This results ina perfectly flat surface in the space domain as shown in the leftmost image in Figure 12 . This surface is perfectly flat and featureless.
| Figure 12. Graphic output for Case 7. |
|---|
 |
The code that was used to generate this surface is shown in Listing 18 . For the case of a sinusoidal wave with zero frequency, every point on the surfacehas a value of 1.0.
| Listing 18. Code for Case 7. |
|---|
case 7:
        for(int row = 0; row<rows; row++){
          for(int col = 0; col<cols; col++){
            spatialData[row][col] = 1.0;}//end inner loop
}//end outer loopbreak; |
As shown by the center image in Figure 12 , the Fourier transform of this surface produces a single point at the origin in wavenumber space. This isexactly what we would expect.
The result of performing an inverse Fourier transform on the complex spectrum is shown in the rightmost image in Figure 12 . As was the case earlier in Figure 6 , the ugliness of this plot is an artifact of the 3D plotting schemeimplemented by the class named ImgMod29 . The explanation that I gave there applies here also.
Once again, the total error is very small. The numeric output shows that the final output surface matches the input surface to within an error that is lessthan about one part in ten to the thirteenth power. Thus, the program produces the expected results for this test case.

Notification Switch
Would you like to follow the 'Digital signal processing - dsp' conversation and receive update notifications?