| << Chapter < Page | Chapter >> Page > |
java Graph03 Dsp028
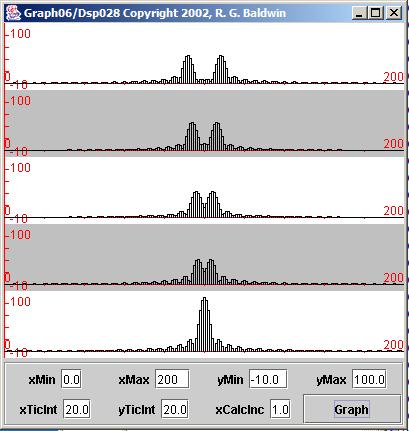
The program named Graph03 is very similar to the program named Graph06 discussed earlier. In fact, the program named Graph06 can be used to produce very similar plots where the sample values are represented by vertical bars instead of being represented byconnected dots. This results in the very interesting display shown in Figure 14 . Each of the vertical bars in Figure 14 represents a computational frequency bin. (Compare Figure 14 with Figure 11 .)
| Figure 14. Output from Graph03. |
|---|
 |
In any event, Graph03 is so similar to Graph06 that I'm not going to discuss it further. A complete listing of the programnamed Graph03 is provided in Listing 20 near the end of the module.
That brings us to the heart of this module, which is the method that actually implements the DFT algorithm and performs the spectral analysis. This is amethod named transform , which is a static method of the class named ForwardRealToComplex01 . You saw this method being called five times in the code in Listing 12 .
As usual, I will discuss this method in fragments. A complete listing of the class is presented in Listing 21 near the end of the module.
The transform method is a rather straightforward implementation of the concepts that I explained in the earlier module titled Fun with Java, How and Why Spectral Analysis Works . If you have not done so already, I strongly urge you go to back and study that module at this time. Youneed to understand those concepts in order for the code in the transform method to make sense.
For those of you who don't have the time to go back and study that module in detail, a brief description of the DFT algorithm follows.
Using a notation that I described in the earlier module, the expressions that you must evaluate to determine the frequency spectral content of a target timeseries at a frequency F are shown in Figure 15 .
| Figure 15. Spectral transform expressions. |
|---|
Real(F) = S(n=0,N-1)[x(n)*cos(2Pi*F*n)]
Imag(F) = S(n=0,N-1)[x(n)*sin(2Pi*F*n)]ComplexAmplitude(F) = Real(F) - j*Imag(F)
Power(F) = Real(F)*Real(F) + Imag(F)*Imag(F)Amplitude(F) = SqRt(Power(F)) |
Before you panic, let me explain what this means in layman's terms. Given a time series, x(n), you can determine if that time series contains a cosinecomponent or a sine component at a given frequency, F, by doing the following:

Notification Switch
Would you like to follow the 'Digital signal processing - dsp' conversation and receive update notifications?