| << Chapter < Page | Chapter >> Page > |
Frequency measures how often a wave passes. We can make a wave with frequency by writing:
Aside : The wave described by has frequency . If we instead write , we will have a wave with frequency 1, which is easier to work with.
We can express the same information in terms of wavelength. Wavelength is how close neighboring waves are to each other. It is inversely proportional to frequency, which means that the higher the frequency, the smaller the wavelength. If is wavelength, we write this in the following way:
A wave with wavelength is written as .
Amplitude measures how high the wave is. We can make a wave of amplitude by writing:
Sometimes will be negative. In this case, we still say that the wave has amplitude , but note that the function will be flipped across the x-axis.
Phase describes how far the wave has been shifted from center. To create a wave with phase , we write:
Since a sin wave repeats every , the following is always true (that is, for any ):
Aside : A cosine wave is a sine wave shifted back by a , a quarter of the standard wave:
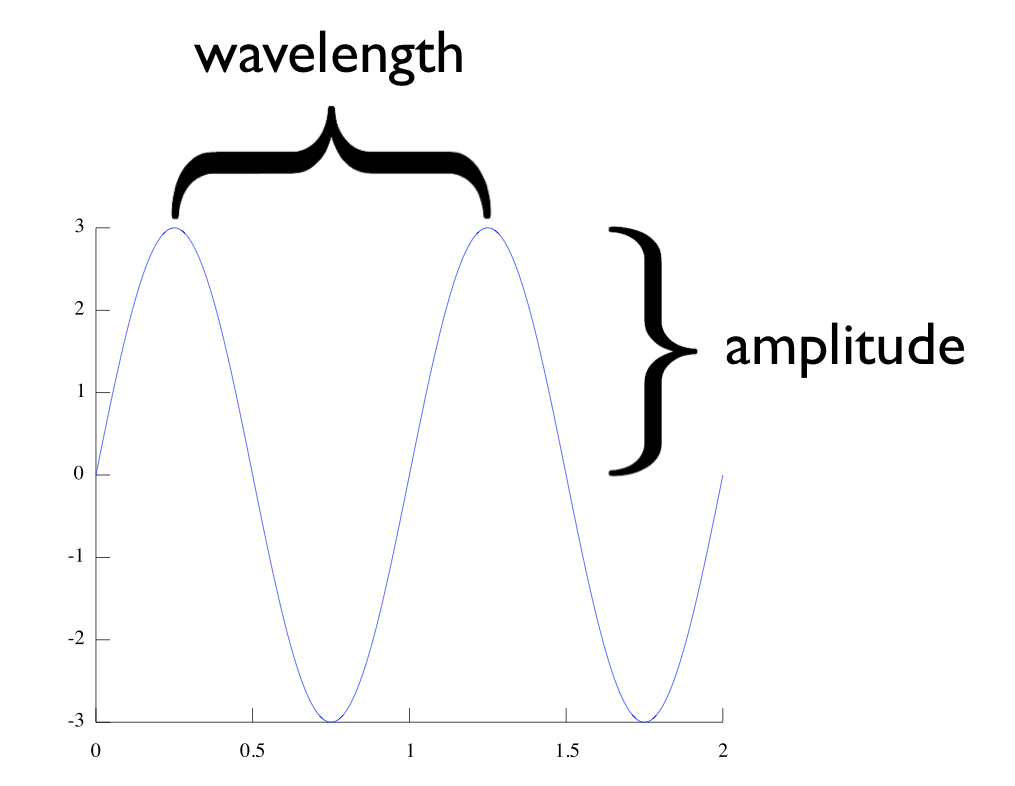
Every sine (cosine) wave can be described completely by these characteristics. These are shown in [link] (phase for simplicity):

To code [link] in MATLAB, use:
>>t = 0:.01:1;>>amp = 3;>>freq = 1;>>phase = 0>>y = amp*sin(freq*2*pi*t + phase);
The sine wave represents a pure tone. To hear one, we use the MATLAB function
sound() , which converts a vector into sound. Find the frequency that is specified, and compare to human range of hearing. Should we be able to hear this sound?
>>freq = 1000;>>samp_rate = 1e4;>>duration = 1;>>samples = 0 : (1/samp_rate) : duration;>>sound_wave = sin(2 * pi * samples * freq);>>sound(sound_wave, samp_rate);
Enter the above code into Matlab to hear the sound.
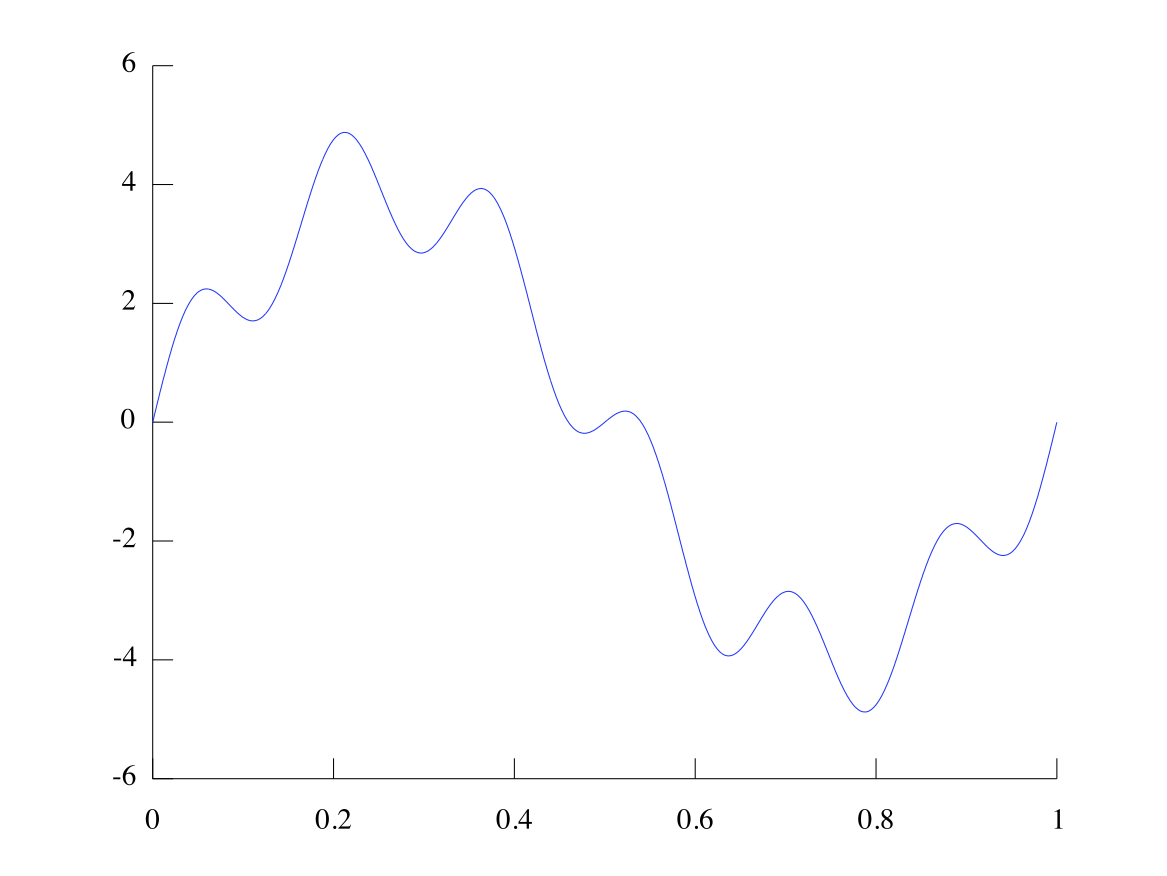
We can add together multiple sin waves to accomplish different shapes. For example, if we add the wave and the wave we get:

Look at the figure and try to identify the effect of each wave. The first wave has frequency 1 and amplitude 4. This accounts for the large up-and-down motion that only goes through one cycle in the figure. The second wave has frequency 6 (wavelength ) and amplitude 1. This accounts for the small wiggles that happen many times in the figure.
Figure 4 is implemented in MATLAB with the following code:
>t = 0:.01:1;>>y = 4*sin(2*pi*t)+sin(6*2*pi*t);>>plot(t,y)
A wave of any shape can be expressed as a sum of sin and cosine waves, although it may take infinitely many. In the end of this module we will find interesting uses for the this fact.
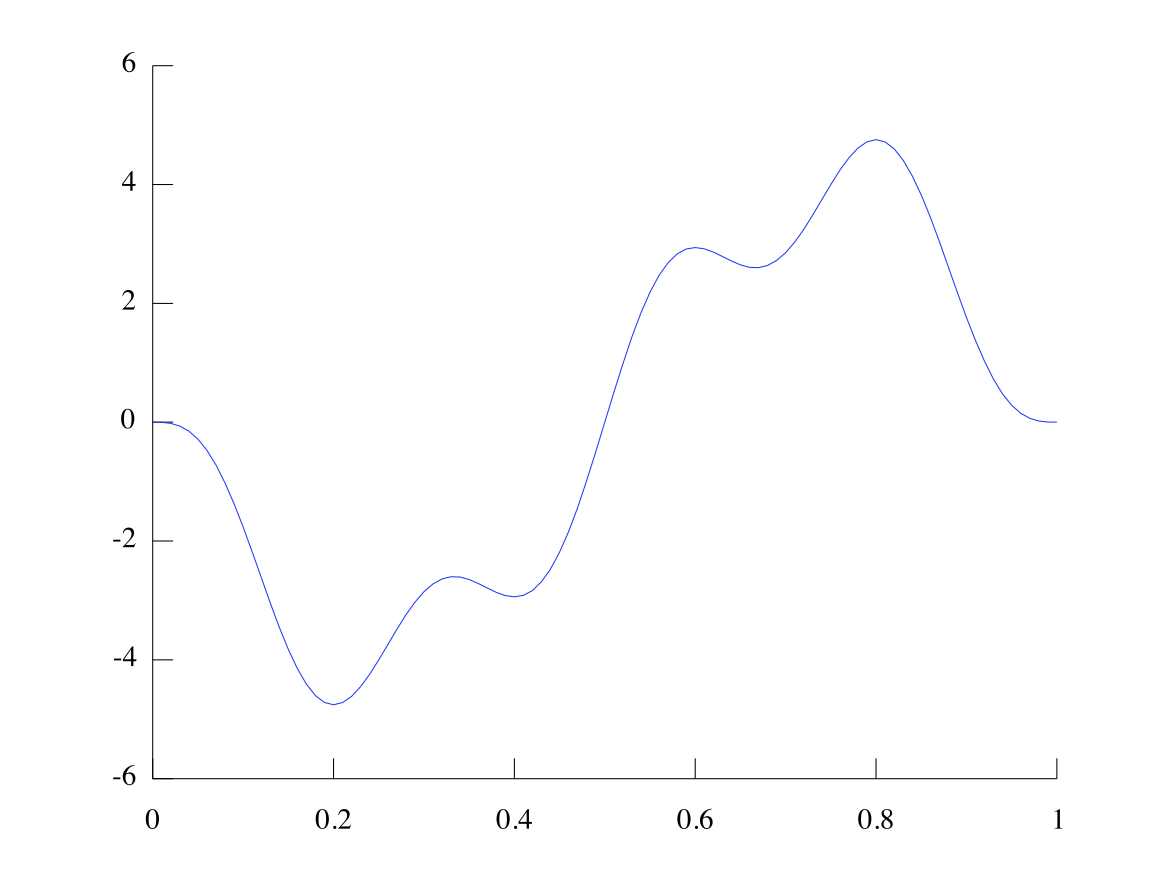
[link] two shows a sum of two sine waves (with phase 0). Try to replicate it, and report what the amplitudes and frequencies of each wave is.

Use the identities and to solve for in the following equations by making the above substitutions. Check your answer visually against the figures of sine and cosine waves:

Notification Switch
Would you like to follow the 'The art of the pfug' conversation and receive update notifications?