<< Chapter < Page Chapter >> Page >

Learning objectives

By the end of this section, you will be able to:

  • Describe the radio and X-ray observations that indicate energetic phenomena are occurring at the galactic center
  • Explain what has been revealed by high-resolution near-infrared imaging of the galactic center
  • Discuss how these near-infrared images, when combined with Kepler’s third law of motion, can be used to derive the mass of the central gravitating object

At the beginning of this chapter, we hinted that the core of our Galaxy contains a large concentration of mass. In fact, we now have evidence that the very center contains a black hole    with a mass equivalent to 4.6 million Suns and that all this mass fits within a sphere that has less than the diameter of Mercury’s orbit. Such monster black holes are called supermassive black holes by astronomers, to indicate that the mass they contain is far greater than that of the typical black hole created by the death of a single star. It is amazing that we have very convincing evidence that this black hole really does exist. After all, recall from the chapter on Black Holes and Curved Spacetime that we cannot see a black hole directly because by definition it radiates no energy. And we cannot even see into the center of the Galaxy in visible light because of absorption by the interstellar dust that lies between us and the galactic center. Light from the central region of the Galaxy is dimmed by a factor of a trillion (10 12 ) by all this dust.

Fortunately, we are not so blind at other wavelengths. Infrared and radio radiation, which have long wavelengths compared to the sizes of the interstellar dust grains, flow unimpeded past the dust particles and so reach our telescopes with hardly any dimming. In fact, the very bright radio source in the nucleus of the Galaxy, now known as Sagittarius A* (pronounced “Sagittarius A-star” and abbreviated Sgr A*), was the first cosmic radio source astronomers discovered.

A journey toward the center

Let’s take a voyage to the mysterious heart of our Galaxy and see what’s there. [link] is a radio image of a region about 1500 light-years across, centered on Sagittarius A , a bright radio source that contains the smaller Sagittarius A * . Much of the radio emission comes from hot gas heated either by clusters of hot stars (the stars themselves do not produce radio emission and can’t be seen in the image) or by supernova blast waves. Most of the hollow circles visible on the radio image are supernova remnants. The other main source of radio emission is from electrons moving at high speed in regions with strong magnetic fields. The bright thin arcs and “threads” on the figure show us where this type of emission is produced.
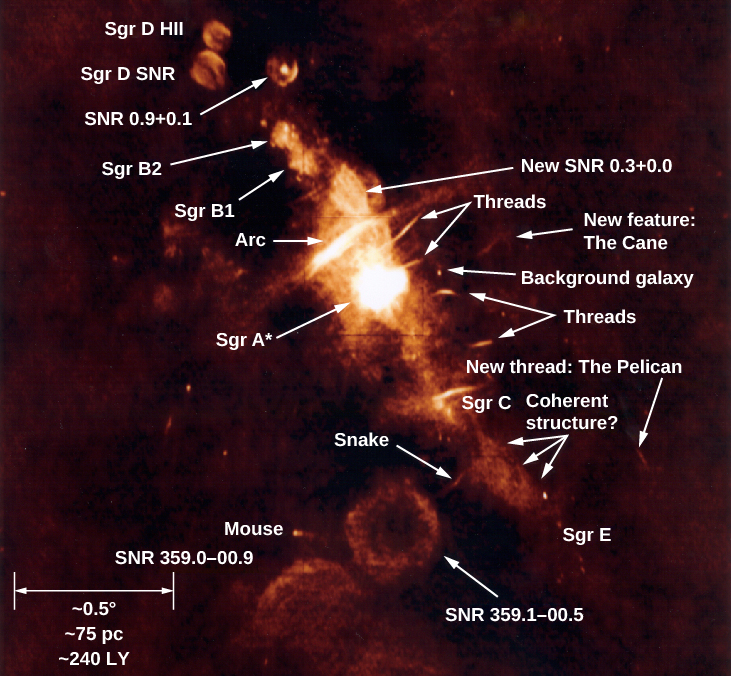
Radio image of galactic center region.

Radio Image of Galactic Center Region. Many features are identified in this complex radio image. The scale at lower left (defined by a double headed horizontal arrow) reads: “~0.5O ~75 pc ~240 LY”. The objects listed, from upper left to lower right, are: “Sgr D HII”, “Sgr D SNR”, “SNR 0.9+0.1”, “Sgr B2”, “Sgr B1”, “New SNR 0.3+0.0”, “Arc”, “Threads”, “Sgr A*”, “New feature: The Cane”, “Background Galaxy”, “Threads”, “New thread: The Pelican”, “Sgr C”, “Coherent structure?”, “Snake” and “Sgr E”. Below center, three more features are labeled (from top to bottom): “SNR 359.1-00.5”, “Mouse” and “SNR 359.0=00.9”.
This radio map of the center of the Galaxy (at a wavelength of 90 centimeters) was constructed from data obtained with the Very Large Array (VLA) of radio telescopes in Socorro, New Mexico. Brighter regions are more intense in radio waves. The galactic center is inside the region labeled Sagittarius A . Sagittarius B1 and B2 are regions of active star formation. Many filaments or threadlike features are seen, as well as a number of shells (labeled SNR), which are supernova remnants. The scale bar at the bottom left is about 240 light-years long. Notice that radio astronomers also give fanciful animal names to some of the structures, much as visible-light nebulae are sometimes given the names of animals they resemble. (credit: modification of work by N. E. Kassim, D. S. Briggs, T. J. W. Lazio, T. N. LaRosa, and J. Imamura (NRL/RSD))

Questions & Answers

A golfer on a fairway is 70 m away from the green, which sits below the level of the fairway by 20 m. If the golfer hits the ball at an angle of 40° with an initial speed of 20 m/s, how close to the green does she come?
Aislinn Reply
cm
tijani
what is titration
John Reply
what is physics
Siyaka Reply
A mouse of mass 200 g falls 100 m down a vertical mine shaft and lands at the bottom with a speed of 8.0 m/s. During its fall, how much work is done on the mouse by air resistance
Jude Reply
Can you compute that for me. Ty
Jude
what is the dimension formula of energy?
David Reply
what is viscosity?
David
what is inorganic
emma Reply
what is chemistry
Youesf Reply
what is inorganic
emma
Chemistry is a branch of science that deals with the study of matter,it composition,it structure and the changes it undergoes
Adjei
please, I'm a physics student and I need help in physics
Adjanou
chemistry could also be understood like the sexual attraction/repulsion of the male and female elements. the reaction varies depending on the energy differences of each given gender. + masculine -female.
Pedro
A ball is thrown straight up.it passes a 2.0m high window 7.50 m off the ground on it path up and takes 1.30 s to go past the window.what was the ball initial velocity
Krampah Reply
2. A sled plus passenger with total mass 50 kg is pulled 20 m across the snow (0.20) at constant velocity by a force directed 25° above the horizontal. Calculate (a) the work of the applied force, (b) the work of friction, and (c) the total work.
Sahid Reply
you have been hired as an espert witness in a court case involving an automobile accident. the accident involved car A of mass 1500kg which crashed into stationary car B of mass 1100kg. the driver of car A applied his brakes 15 m before he skidded and crashed into car B. after the collision, car A s
Samuel Reply
can someone explain to me, an ignorant high school student, why the trend of the graph doesn't follow the fact that the higher frequency a sound wave is, the more power it is, hence, making me think the phons output would follow this general trend?
Joseph Reply
Nevermind i just realied that the graph is the phons output for a person with normal hearing and not just the phons output of the sound waves power, I should read the entire thing next time
Joseph
Follow up question, does anyone know where I can find a graph that accuretly depicts the actual relative "power" output of sound over its frequency instead of just humans hearing
Joseph
"Generation of electrical energy from sound energy | IEEE Conference Publication | IEEE Xplore" ***ieeexplore.ieee.org/document/7150687?reload=true
Ryan
what's motion
Maurice Reply
what are the types of wave
Maurice
answer
Magreth
progressive wave
Magreth
hello friend how are you
Muhammad Reply
fine, how about you?
Mohammed
hi
Mujahid
A string is 3.00 m long with a mass of 5.00 g. The string is held taut with a tension of 500.00 N applied to the string. A pulse is sent down the string. How long does it take the pulse to travel the 3.00 m of the string?
yasuo Reply
Who can show me the full solution in this problem?
Reofrir Reply
Got questions? Join the online conversation and get instant answers!
Jobilize.com Reply
Practice Key Terms 1

Get Jobilize Job Search Mobile App in your pocket Now!

Get it on Google Play Download on the App Store Now


Source:  OpenStax, Astronomy. OpenStax CNX. Apr 12, 2017 Download for free at http://cnx.org/content/col11992/1.13
Google Play and the Google Play logo are trademarks of Google Inc.

Notification Switch

Would you like to follow the 'Astronomy' conversation and receive update notifications?

Ask