<< Chapter < Page Chapter >> Page >

Learning objectives

By the end of this section, you will be able to:

  • Explain how the H–R diagram    of a star cluster can be related to the cluster’s age and the stages of evolution of its stellar members
  • Describe how the main-sequence turnoff of a cluster reveals its age

In the previous section, we indicated that that open clusters are younger than globular clusters, and associations are typically even younger. In this section, we will show how we determine the ages of these star clusters. The key observation is that the stars in these different types of clusters are found in different places in the H–R diagram, and we can use their locations in the diagram in combination with theoretical calculations to estimate how long they have lived.

H–r diagrams of young clusters

What does theory predict for the H–R diagram of a cluster whose stars have recently condensed from an interstellar cloud? Remember that at every stage of evolution, massive stars evolve more quickly than their lower-mass counterparts. After a few million years (“recently” for astronomers), the most massive stars should have completed their contraction phase and be on the main sequence, while the less massive ones should be off to the right, still on their way to the main sequence. These ideas are illustrated in [link] , which shows the H–R diagram calculated by R. Kippenhahn and his associates at Munich University for a hypothetical cluster with an age of 3 million years.
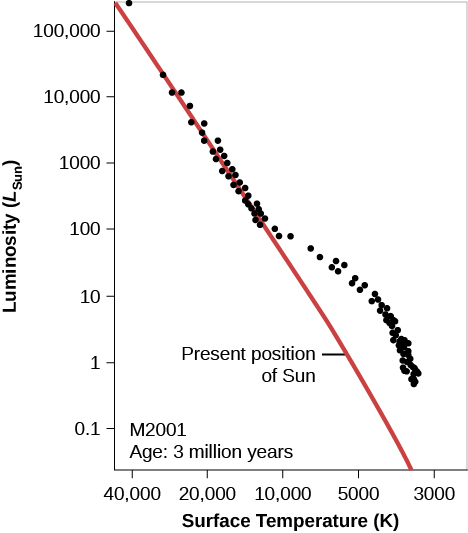
Young cluster h–r diagram.

Hypothetical H-R Diagram of a Young Cluster. In this plot titled “M 2001 Age: 3 million years,” the vertical axis is labeled “Luminosity (LSun),” and goes from 0.1 at the bottom to 100,000 at the top. The horizontal axis is labeled “Surface Temperature (K)”, and goes from 40,000 on the left to 3,000 on the right. The zero-age main sequence is drawn as a red diagonal line starting just above 100,000 LSun at the top of the graph down to about 4000 K at the bottom. The “Present position of Sun” is indicated at 5500 K and 1 LSun. Over-plotted on the graph are black dots representing the individual stars in the cluster. About half of the dots lie neatly along the red line until about 10000 K and 100 LSun. At this point, the remainder of the dots lie above the red line, meaning these stars have yet to reach the main sequence.
We see an H–R diagram for a hypothetical young cluster with an age of 3 million years. Note that the high-mass (high-luminosity) stars have already arrived at the main-sequence stage of their lives, while the lower-mass (lower-luminosity) stars are still contracting toward the zero-age main sequence (the red line) and are not yet hot enough to derive all of their energy from the fusion of hydrogen.

There are real star clusters that fit this description. The first to be studied (in about 1950) was NGC 2264, which is still associated with the region of gas and dust from which it was born ( [link] ).
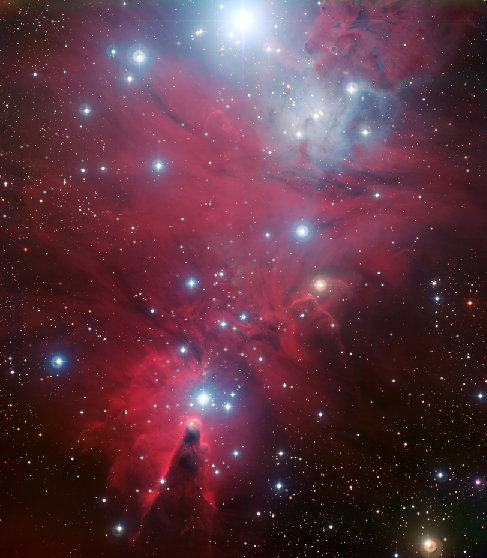
Young cluster ngc 2264.

Image of the Young Cluster N G C 2264. This youthful cluster derives its name from the shape outlined by its brightest stars. The “Christmas Tree” is upside down in this image. The brightest star at the top of the frame is the base of the tree. The top of the tree is the star above the dark v-shaped lane in the nebula just left of the center at the bottom of the image.
Located about 2600 light-years from us, this region of newly formed stars, known as the Christmas Tree Cluster, is a complex mixture of hydrogen gas (which is ionized by hot embedded stars and shown in red), dark obscuring dust lanes, and brilliant young stars. The image shows a scene about 30 light-years across. (credit: ESO)

The NGC 2264 cluster’s H–R diagram is shown in [link] . The cluster in the middle of the Orion Nebula (shown in [link] and [link] ) is in a similar stage of evolution.
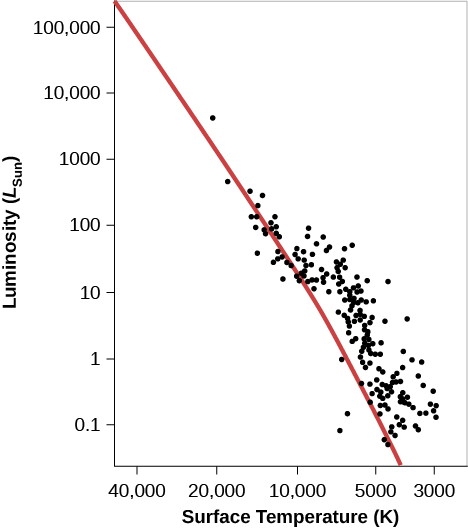
Ngc 2264 h–r diagram.

In this plot the vertical axis is labeled “Luminosity (LSun)” and goes from 0.1 at the bottom to 100,000 at the top. The horizontal axis is labeled “Surface Temperature (K)” and goes from 40,000 on the left to 3,000 on the right. The zero-age main sequence is drawn as a red diagonal line starting just above 100,000 LSun at the top of the graph down to about 4000 K at the bottom. Over plotted are the observed values of stars in N G C 2264, shown as black dots. Stars lie on the line until about 10000 K and 10 LSun, below which the stars reside above the main sequence.
Compare this H–R diagram to that in [link] ; although the points scatter a bit more here, the theoretical and observational diagrams are remarkably, and satisfyingly, similar.

As clusters get older, their H–R diagrams begin to change. After a short time (less than a million years after they reach the main sequence), the most massive stars use up the hydrogen in their cores and evolve off the main sequence to become red giants and supergiants. As more time passes, stars of lower mass begin to leave the main sequence and make their way to the upper right of the H–R diagram.

Questions & Answers

material that allows electric current to pass through
Deng Reply
material which don't allow electric current is called
Deng
insulators
Covenant
how to study physic and understand
Ewa Reply
what is conservative force with examples
Moses
what is work
Fredrick Reply
the transfer of energy by a force that causes an object to be displaced; the product of the component of the force in the direction of the displacement and the magnitude of the displacement
AI-Robot
why is it from light to gravity
Esther Reply
difference between model and theory
Esther
Is the ship moving at a constant velocity?
Kamogelo Reply
The full note of modern physics
aluet Reply
introduction to applications of nuclear physics
aluet Reply
the explanation is not in full details
Moses Reply
I need more explanation or all about kinematics
Moses
yes
zephaniah
I need more explanation or all about nuclear physics
aluet
Show that the equal masses particles emarge from collision at right angle by making explicit used of fact that momentum is a vector quantity
Muhammad Reply
yh
Isaac
A wave is described by the function D(x,t)=(1.6cm) sin[(1.2cm^-1(x+6.8cm/st] what are:a.Amplitude b. wavelength c. wave number d. frequency e. period f. velocity of speed.
Majok Reply
what is frontier of physics
Somto Reply
A body is projected upward at an angle 45° 18minutes with the horizontal with an initial speed of 40km per second. In hoe many seconds will the body reach the ground then how far from the point of projection will it strike. At what angle will the horizontal will strike
Gufraan Reply
Suppose hydrogen and oxygen are diffusing through air. A small amount of each is released simultaneously. How much time passes before the hydrogen is 1.00 s ahead of the oxygen? Such differences in arrival times are used as an analytical tool in gas chromatography.
Ezekiel Reply
please explain
Samuel
what's the definition of physics
Mobolaji Reply
what is physics
Nangun Reply
the science concerned with describing the interactions of energy, matter, space, and time; it is especially interested in what fundamental mechanisms underlie every phenomenon
AI-Robot
Got questions? Join the online conversation and get instant answers!
Jobilize.com Reply
Practice Key Terms 1

Get Jobilize Job Search Mobile App in your pocket Now!

Get it on Google Play Download on the App Store Now


Source:  OpenStax, Astronomy. OpenStax CNX. Apr 12, 2017 Download for free at http://cnx.org/content/col11992/1.13
Google Play and the Google Play logo are trademarks of Google Inc.

Notification Switch

Would you like to follow the 'Astronomy' conversation and receive update notifications?

Ask