| << Chapter < Page | Chapter >> Page > |
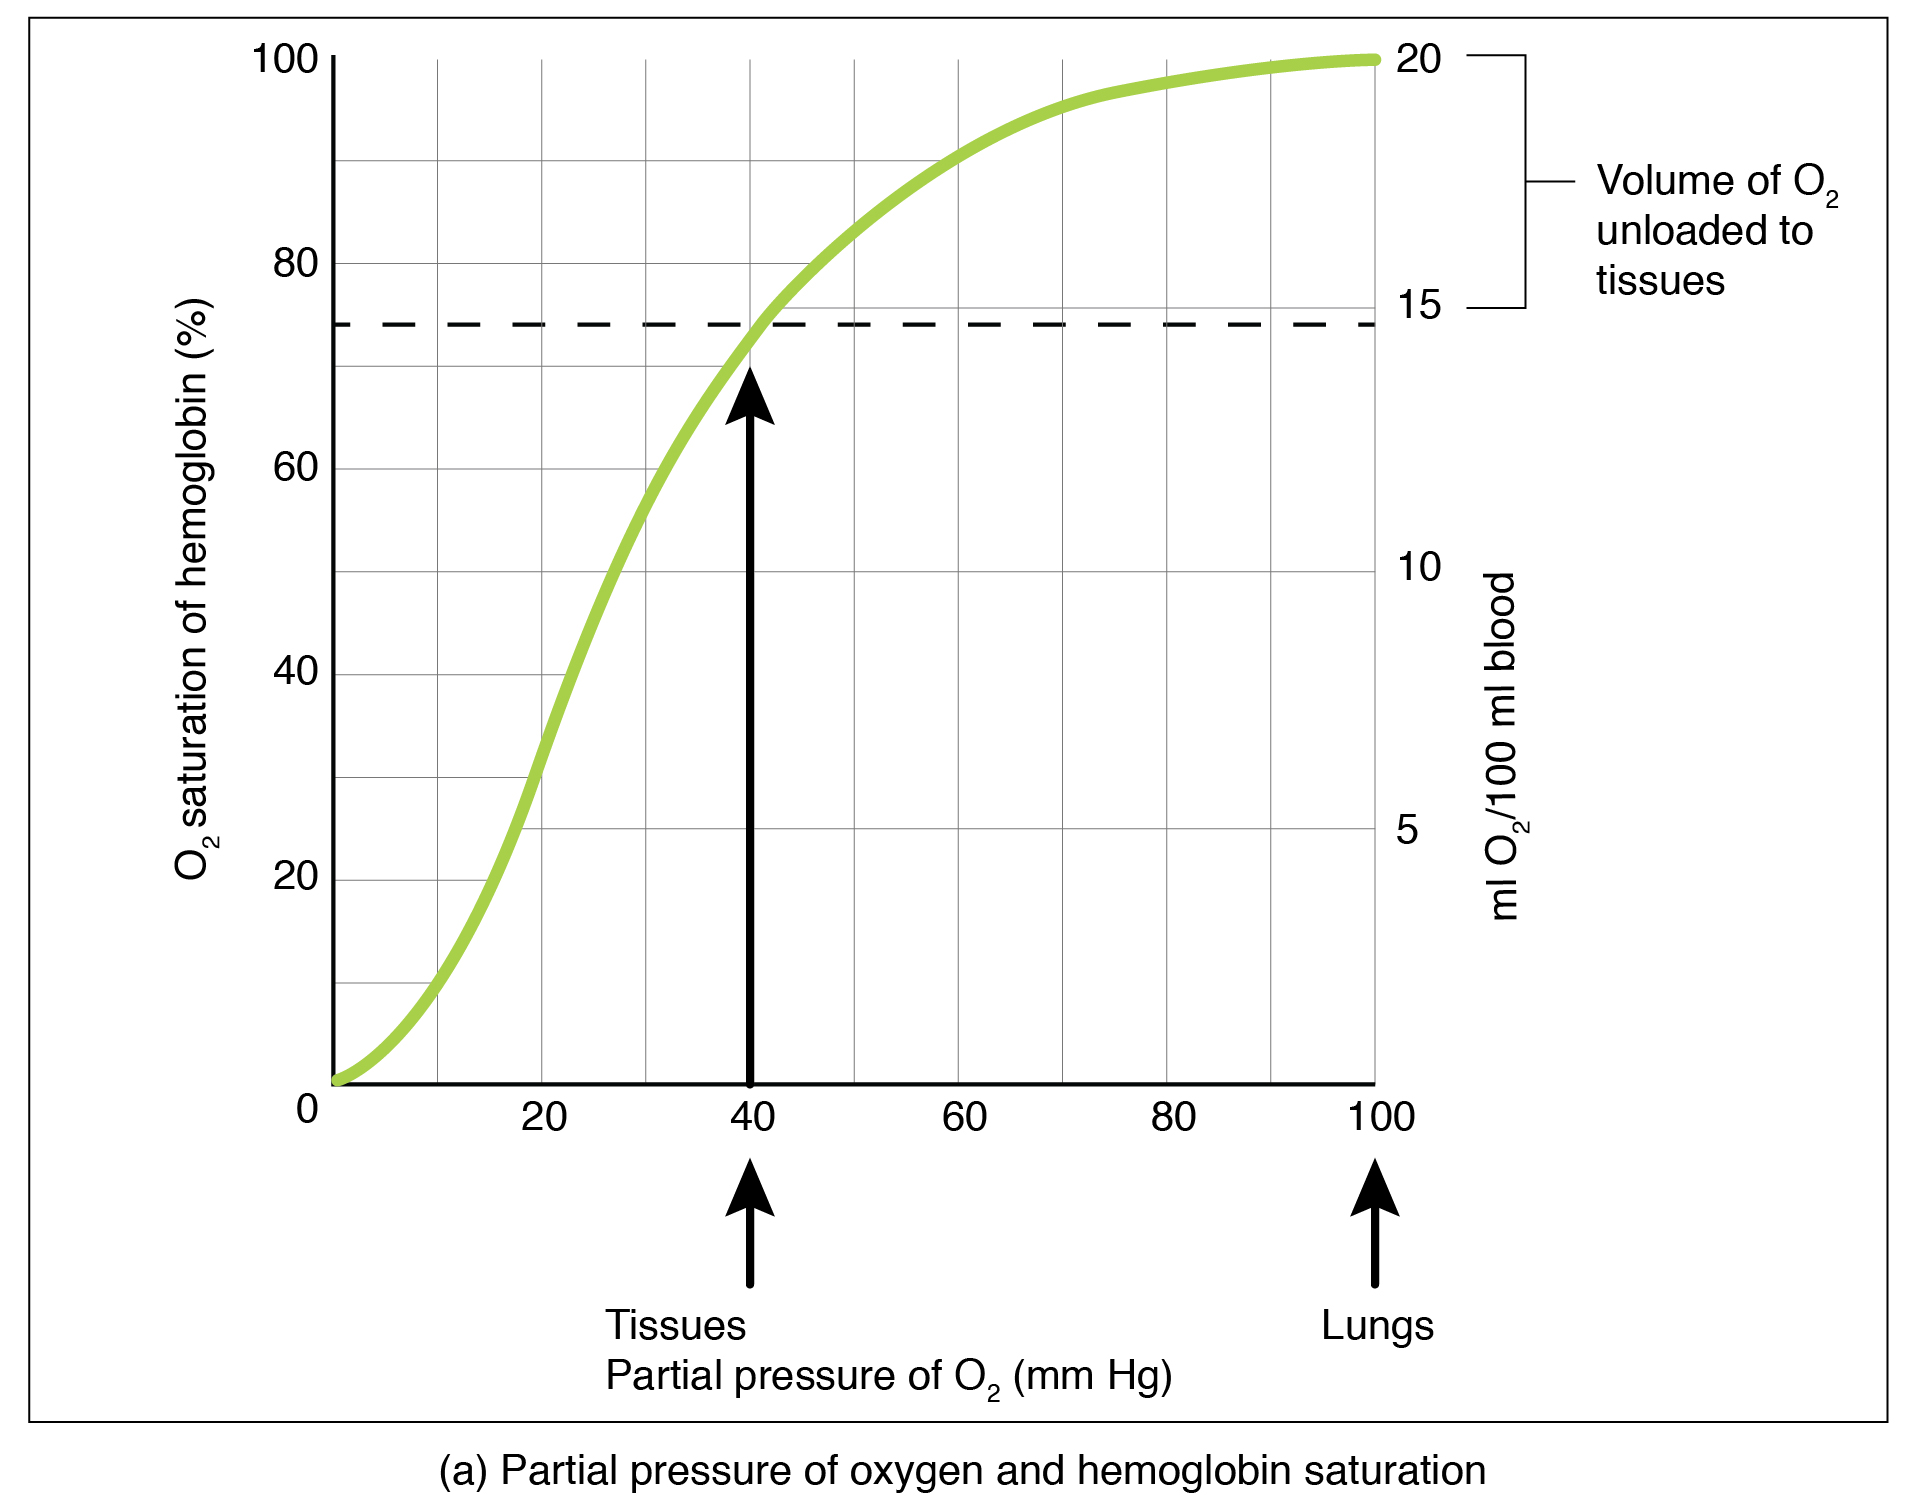
Partial pressure is an important aspect of the binding of oxygen to and disassociation from heme. An oxygen–hemoglobin dissociation curve is a graph that describes the relationship of partial pressure to the binding of oxygen to heme and its subsequent dissociation from heme ( [link] ). Remember that gases travel from an area of higher partial pressure to an area of lower partial pressure. In addition, the affinity of an oxygen molecule for heme increases as more oxygen molecules are bound. Therefore, in the oxygen–hemoglobin saturation curve, as the partial pressure of oxygen increases, a proportionately greater number of oxygen molecules are bound by heme. Not surprisingly, the oxygen–hemoglobin saturation/dissociation curve also shows that the lower the partial pressure of oxygen, the fewer oxygen molecules are bound to heme. As a result, the partial pressure of oxygen plays a major role in determining the degree of binding of oxygen to heme at the site of the respiratory membrane, as well as the degree of dissociation of oxygen from heme at the site of body tissues.


The mechanisms behind the oxygen–hemoglobin saturation/dissociation curve also serve as automatic control mechanisms that regulate how much oxygen is delivered to different tissues throughout the body. This is important because some tissues have a higher metabolic rate than others. Highly active tissues, such as muscle, rapidly use oxygen to produce ATP, lowering the partial pressure of oxygen in the tissue to about 20 mm Hg. The partial pressure of oxygen inside capillaries is about 100 mm Hg, so the difference between the two becomes quite high, about 80 mm Hg. As a result, a greater number of oxygen molecules dissociate from hemoglobin and enter the tissues. The reverse is true of tissues, such as adipose (body fat), which have lower metabolic rates. Because less oxygen is used by these cells, the partial pressure of oxygen within such tissues remains relatively high, resulting in fewer oxygen molecules dissociating from hemoglobin and entering the tissue interstitial fluid. Although venous blood is said to be deoxygenated, some oxygen is still bound to hemoglobin in its red blood cells. This provides an oxygen reserve that can be used when tissues suddenly demand more oxygen.
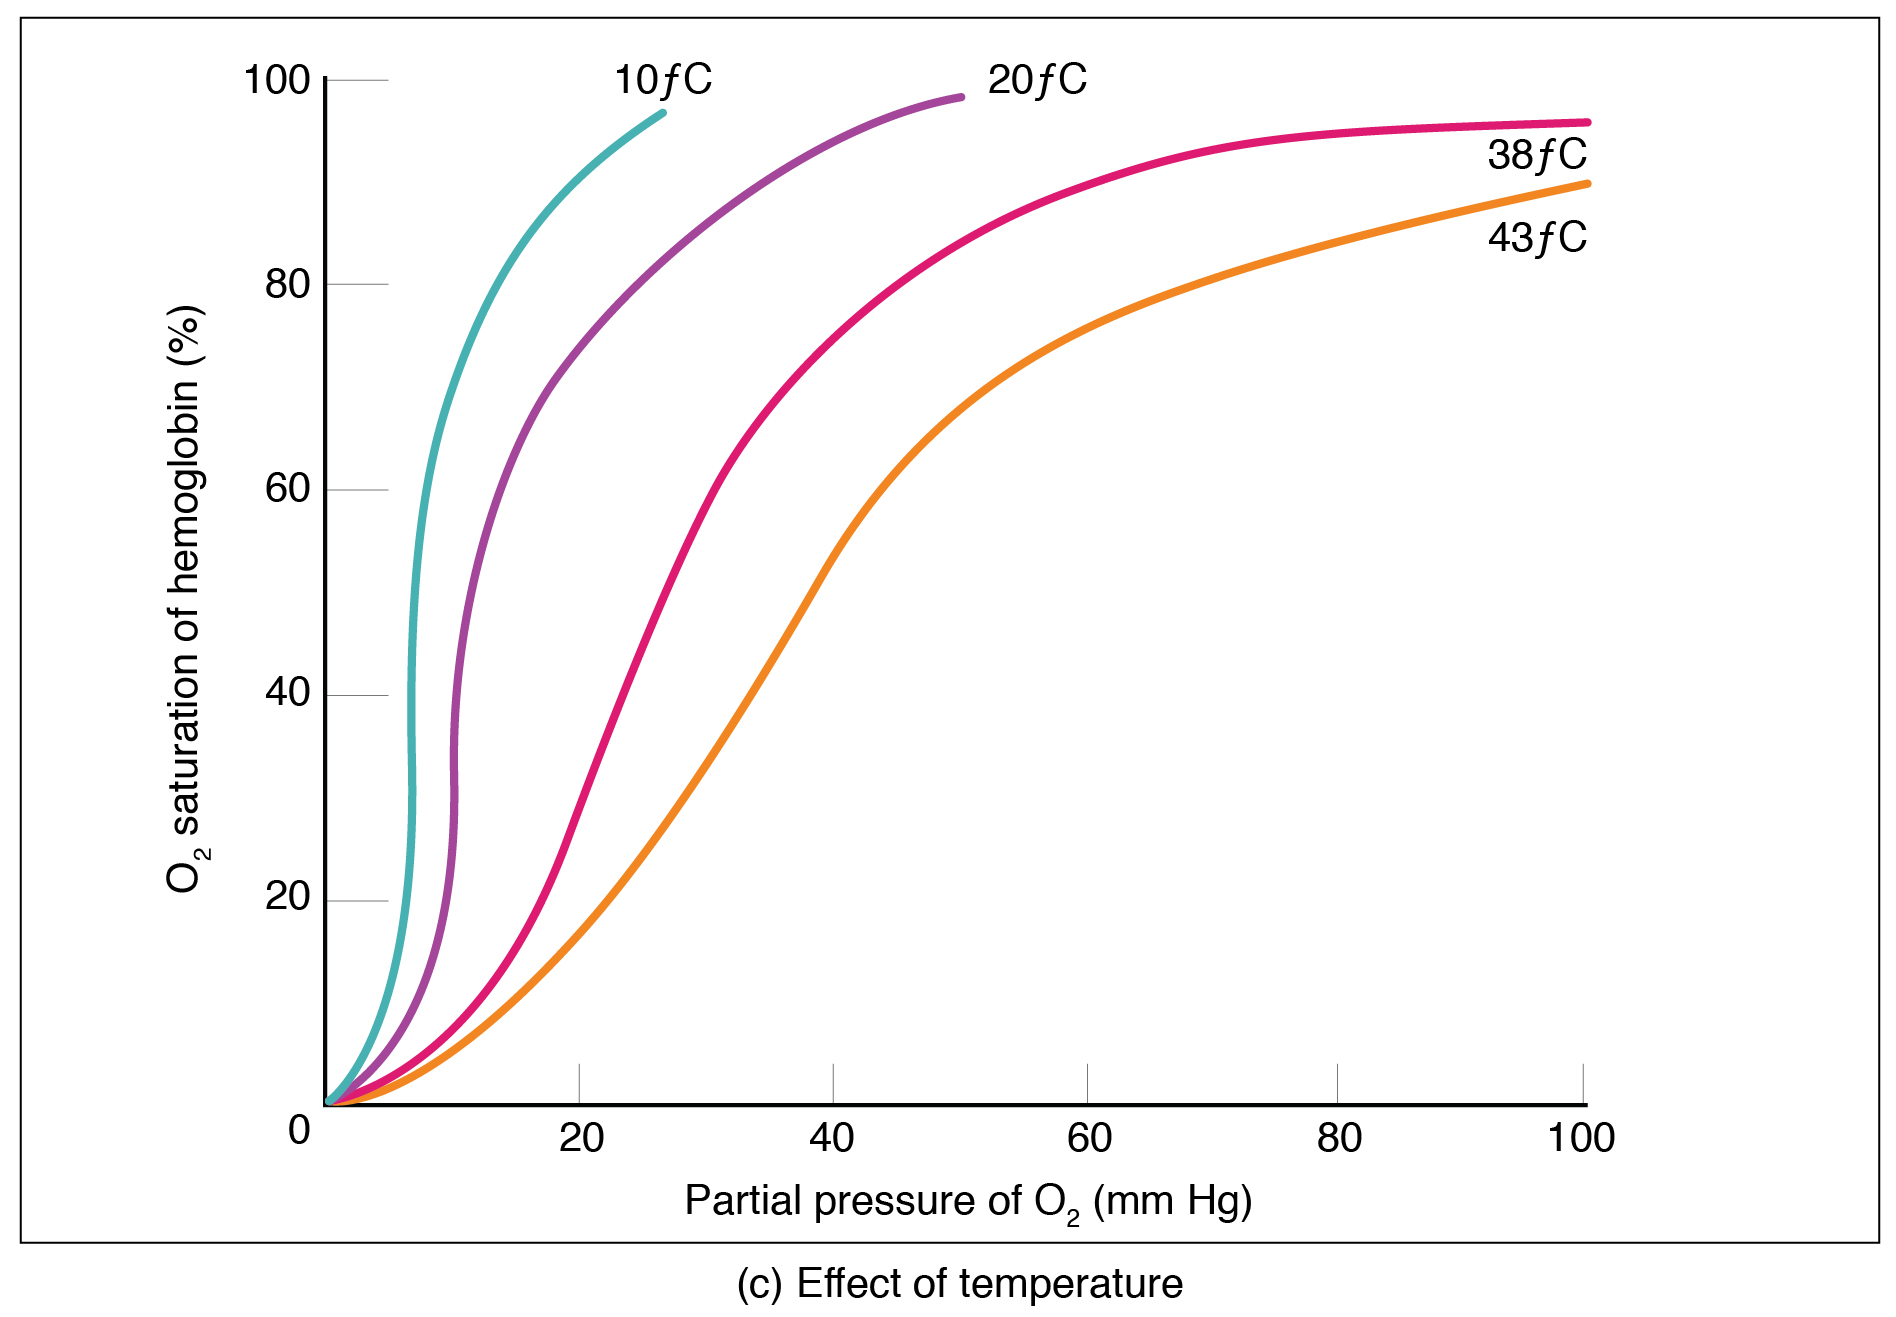
Factors other than partial pressure also affect the oxygen–hemoglobin saturation/dissociation curve. For example, a higher temperature promotes hemoglobin and oxygen to dissociate faster, whereas a lower temperature inhibits dissociation (see [link] , middle ). However, the human body tightly regulates temperature, so this factor may not affect gas exchange throughout the body. The exception to this is in highly active tissues, which may release a larger amount of energy than is given off as heat. As a result, oxygen readily dissociates from hemoglobin, which is a mechanism that helps to provide active tissues with more oxygen.

Notification Switch
Would you like to follow the 'Anatomy & Physiology' conversation and receive update notifications?